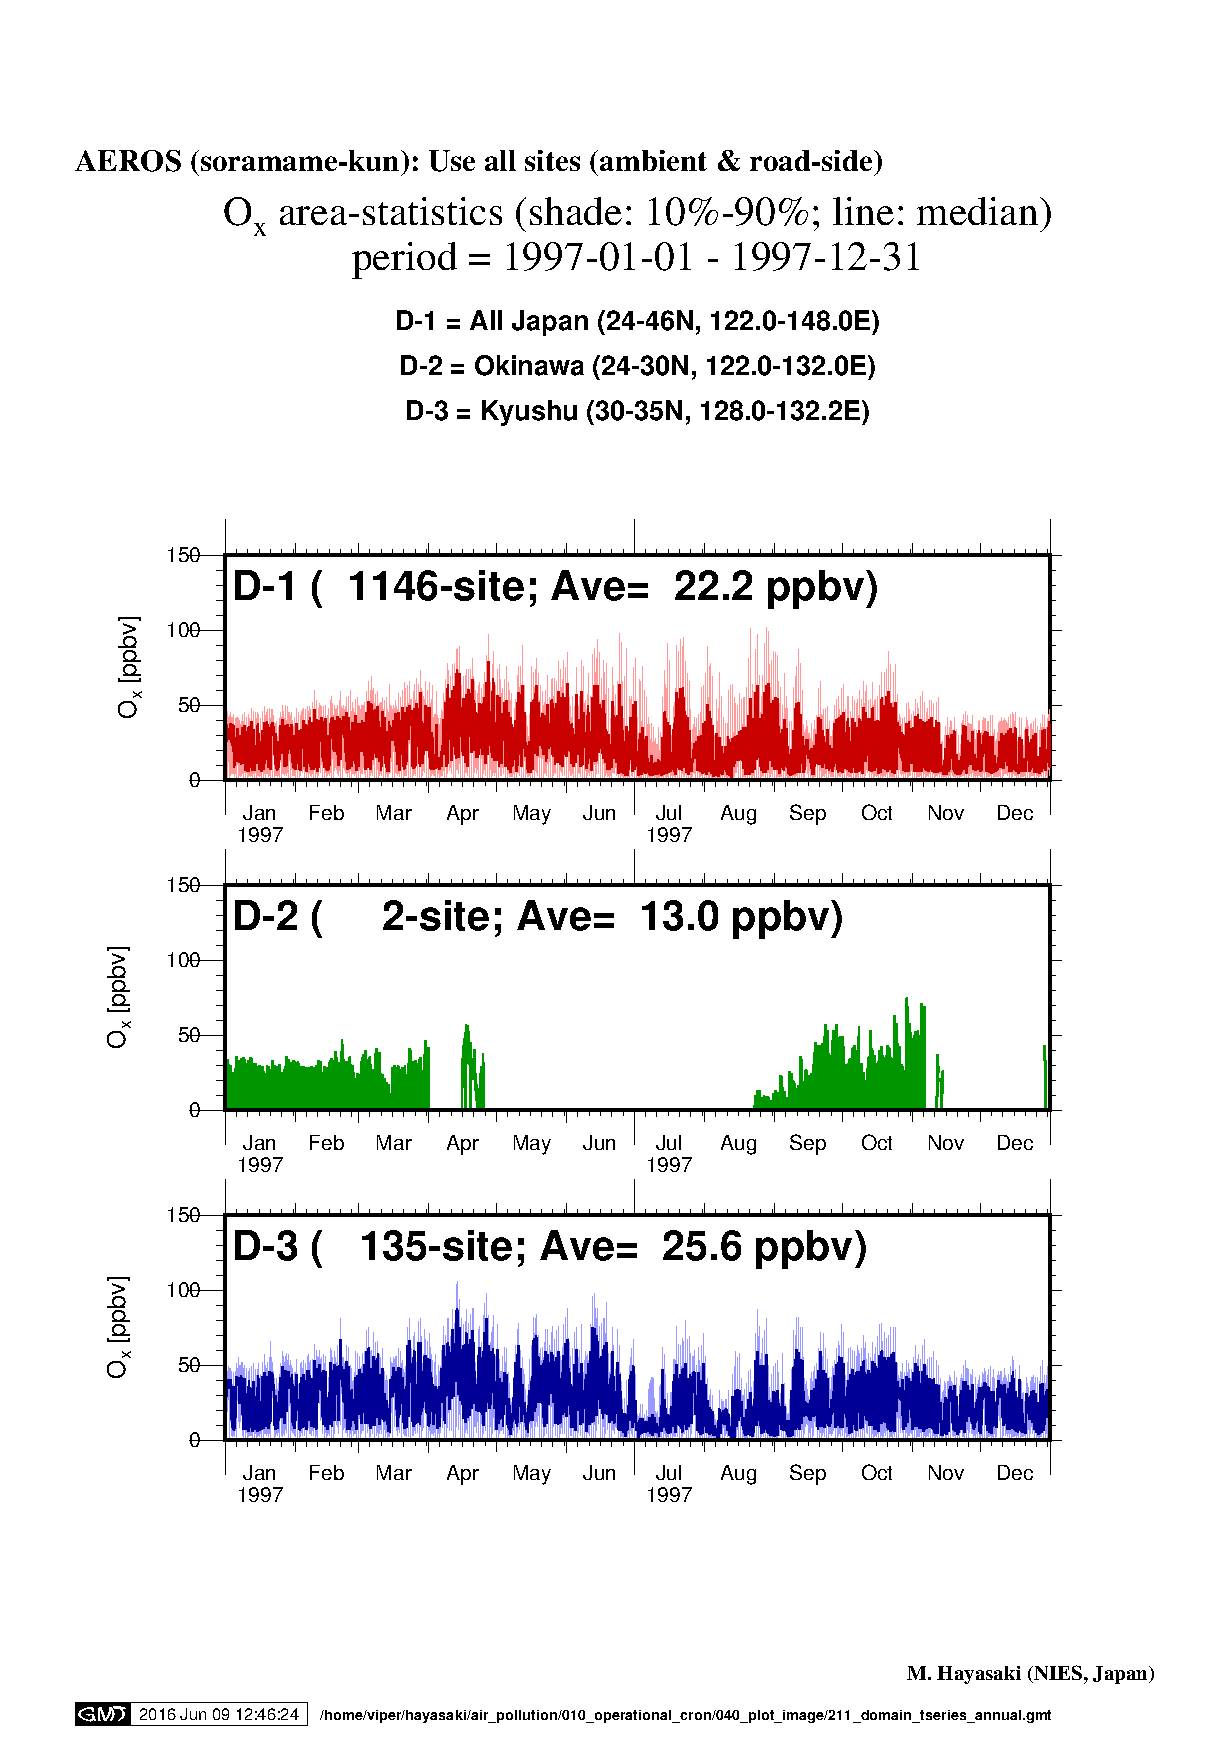
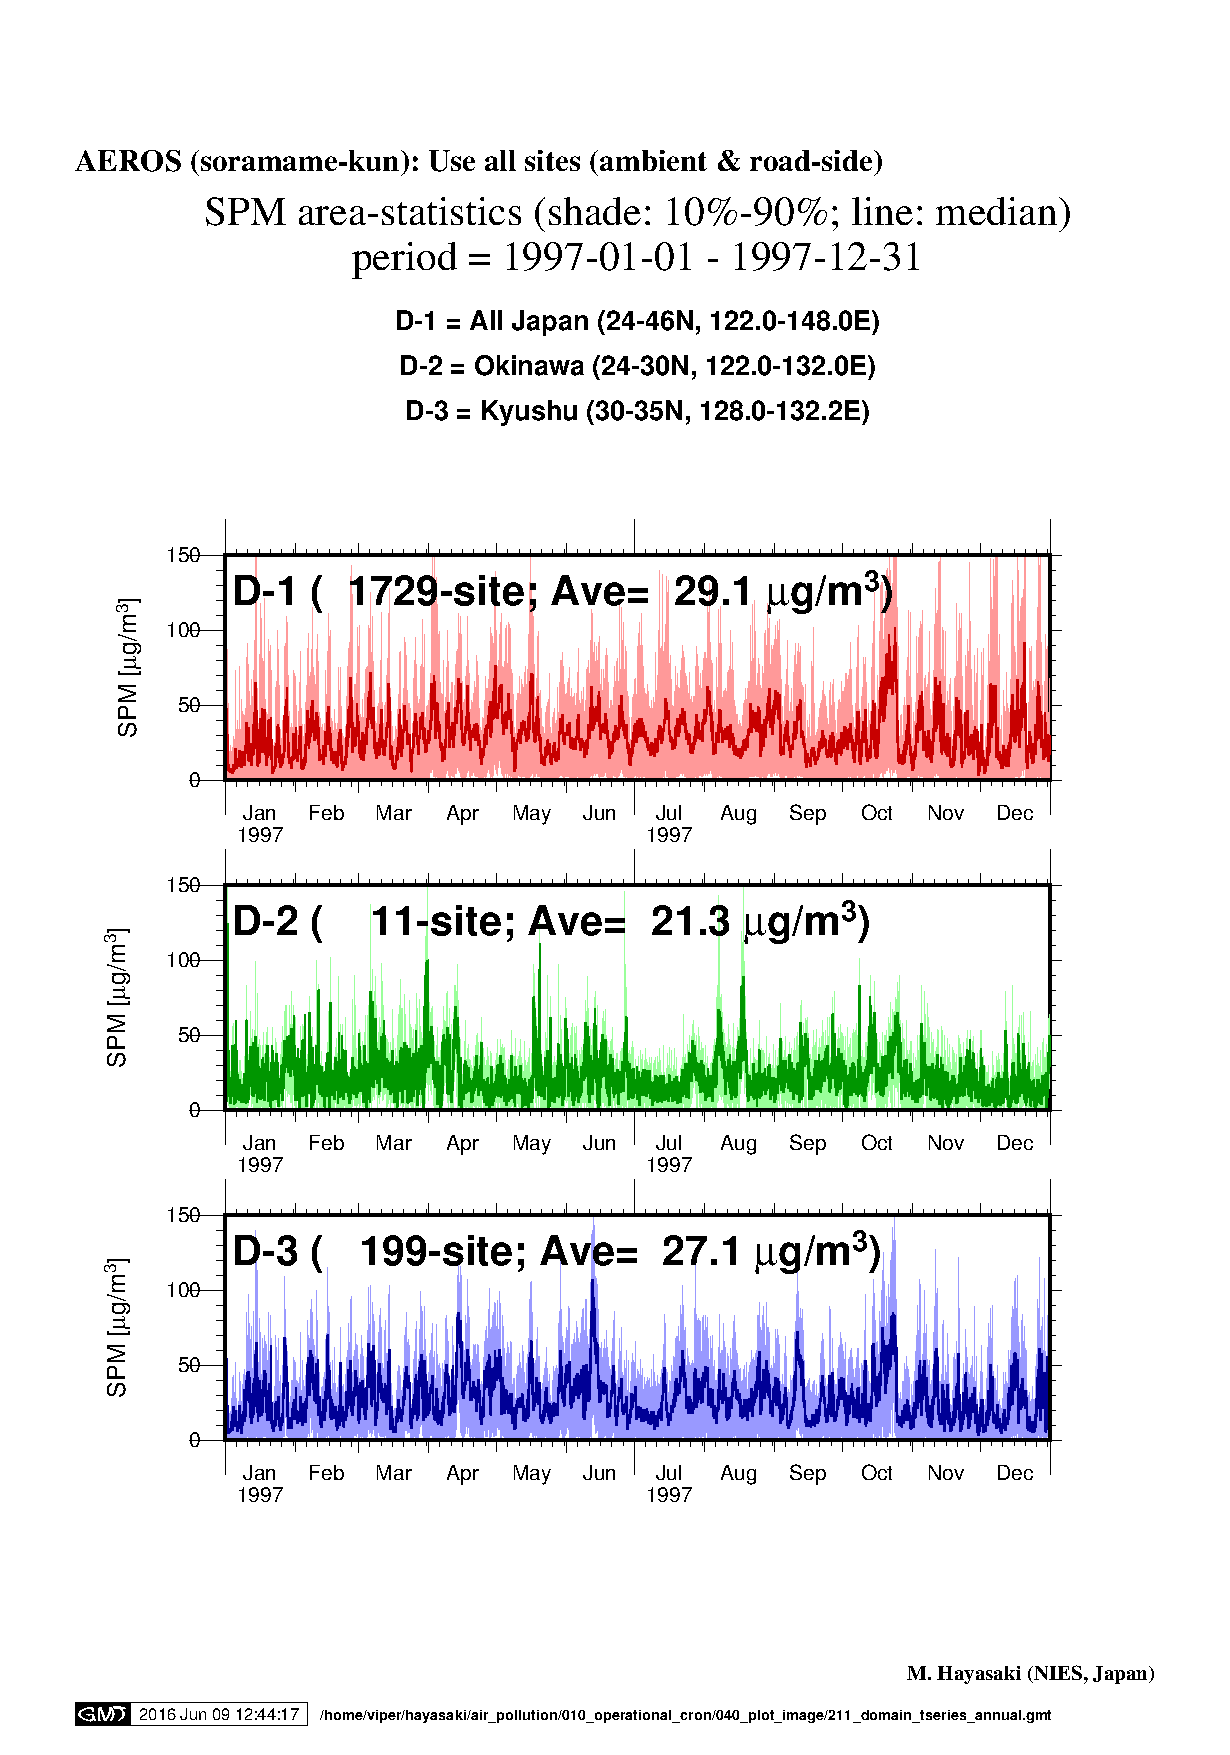
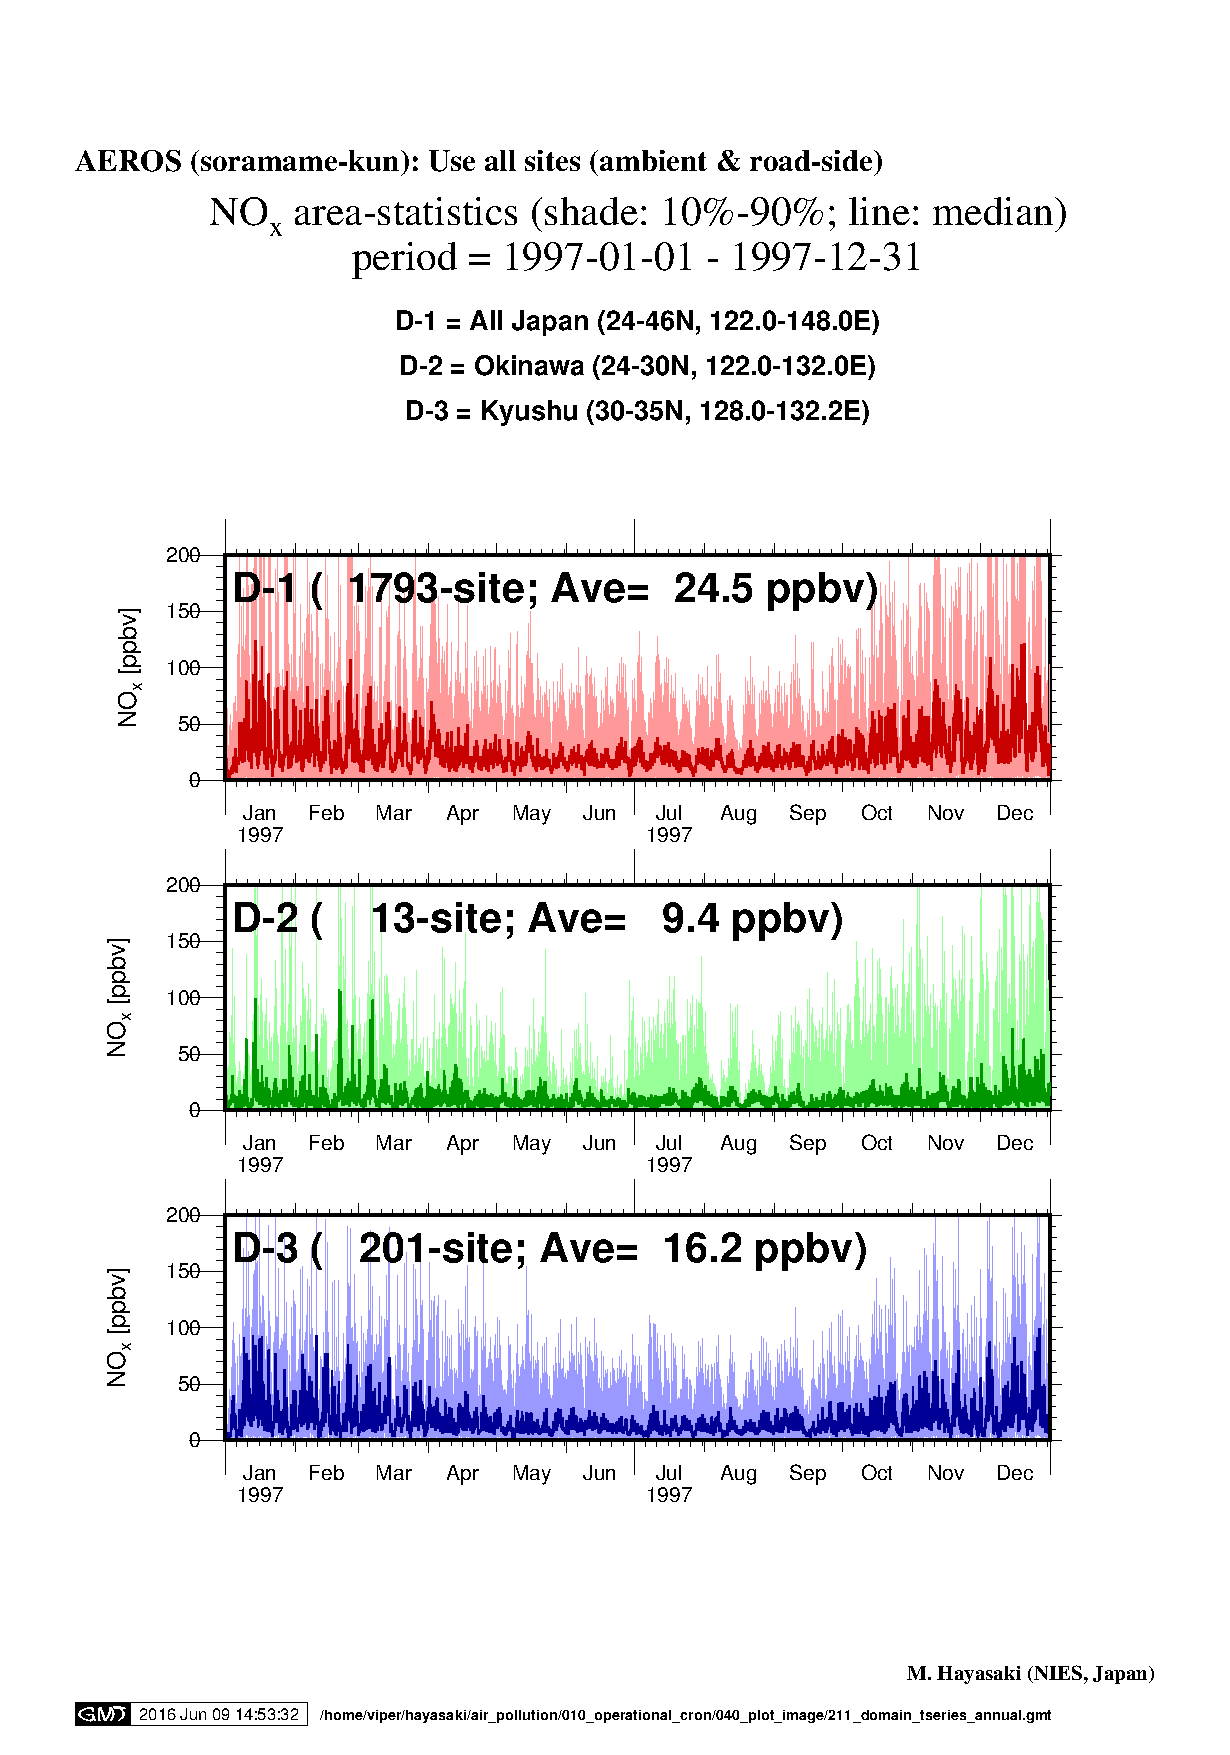
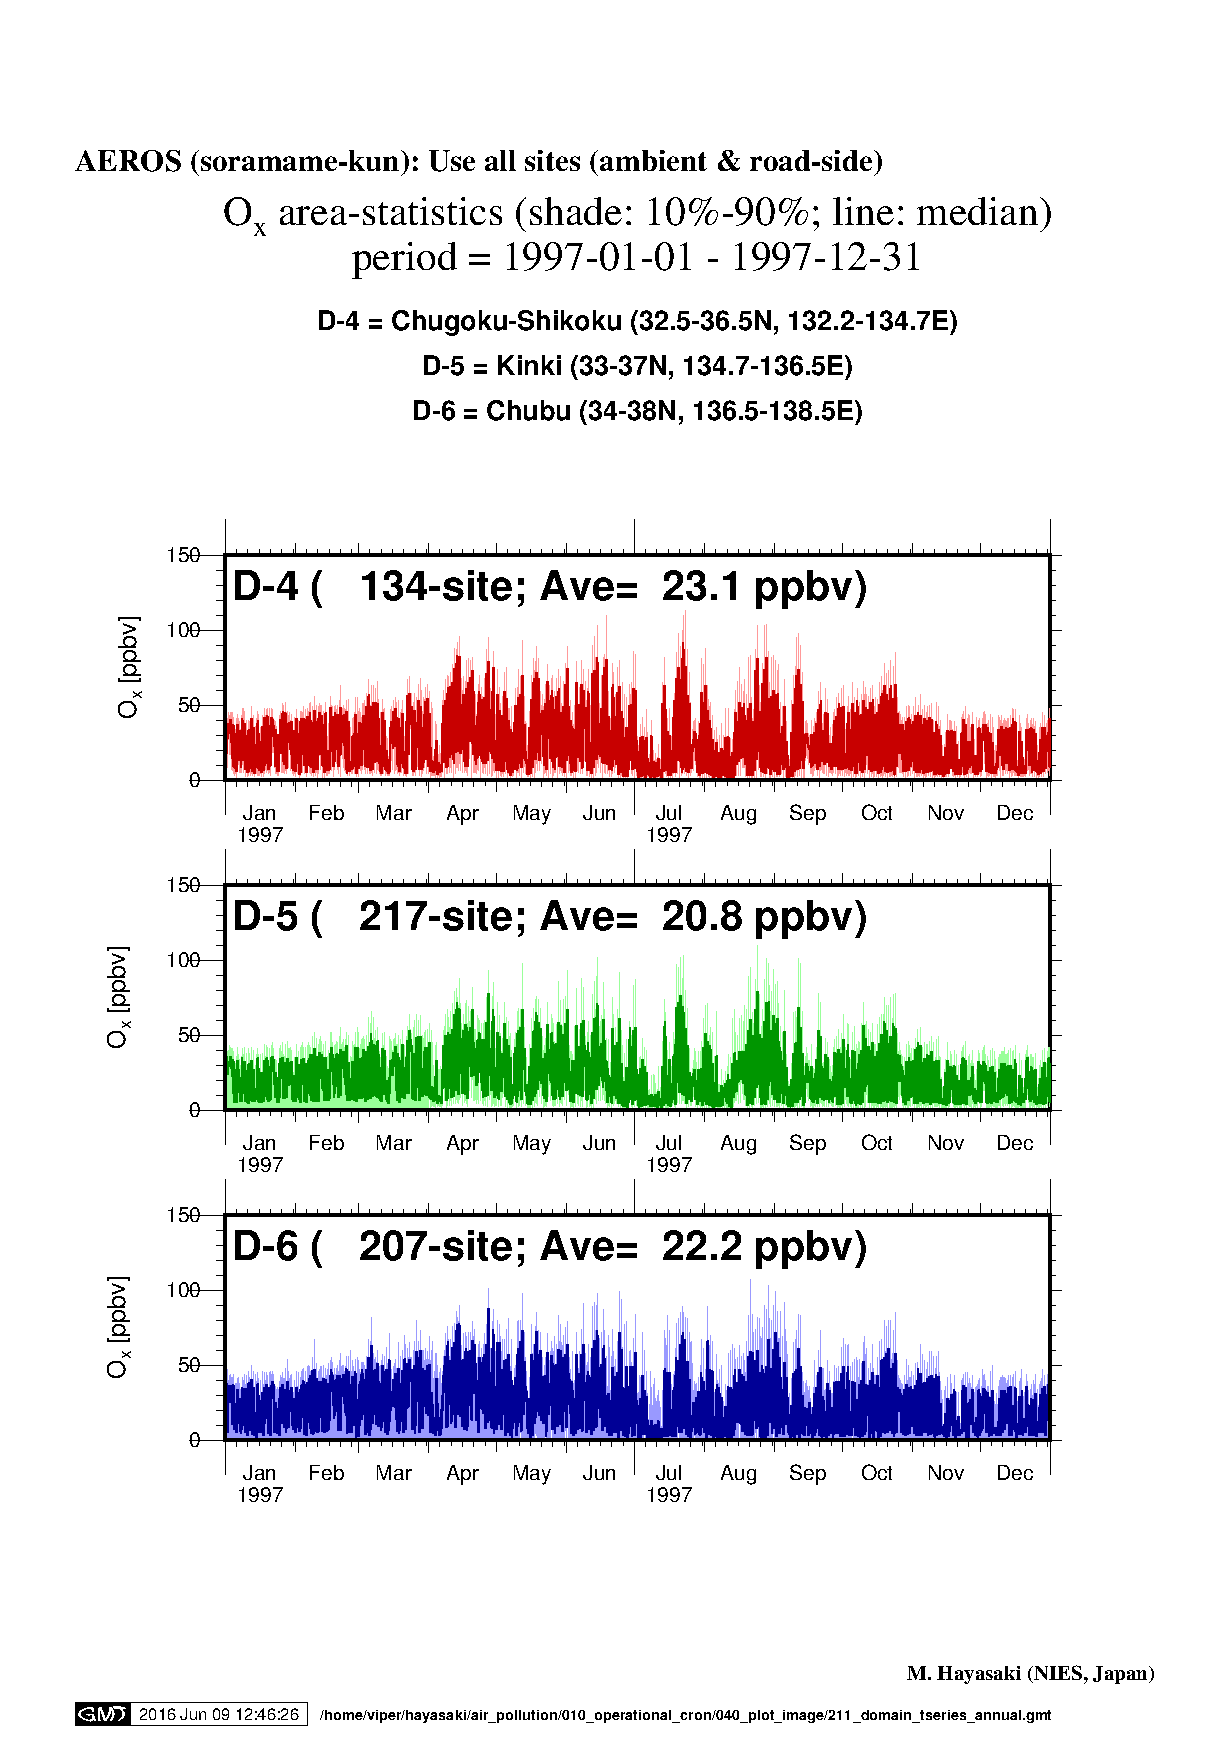
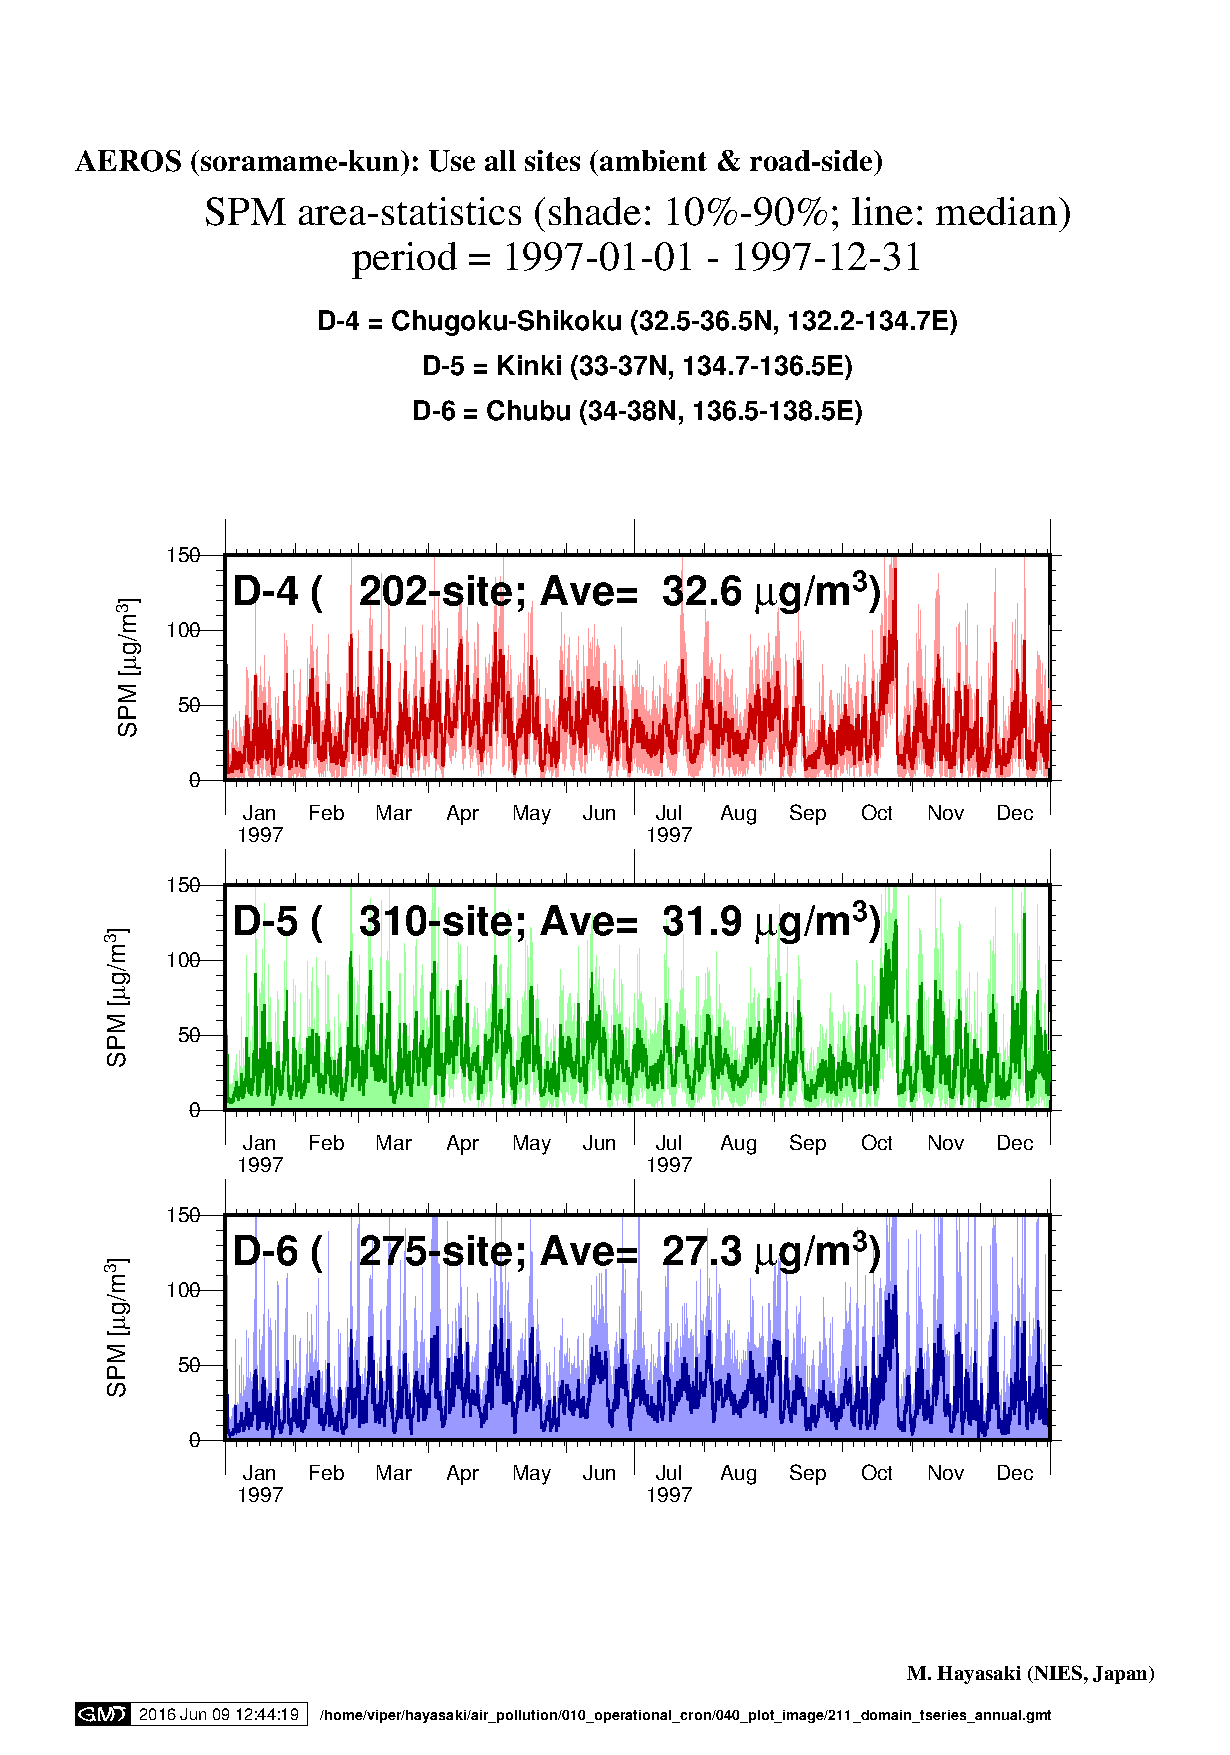
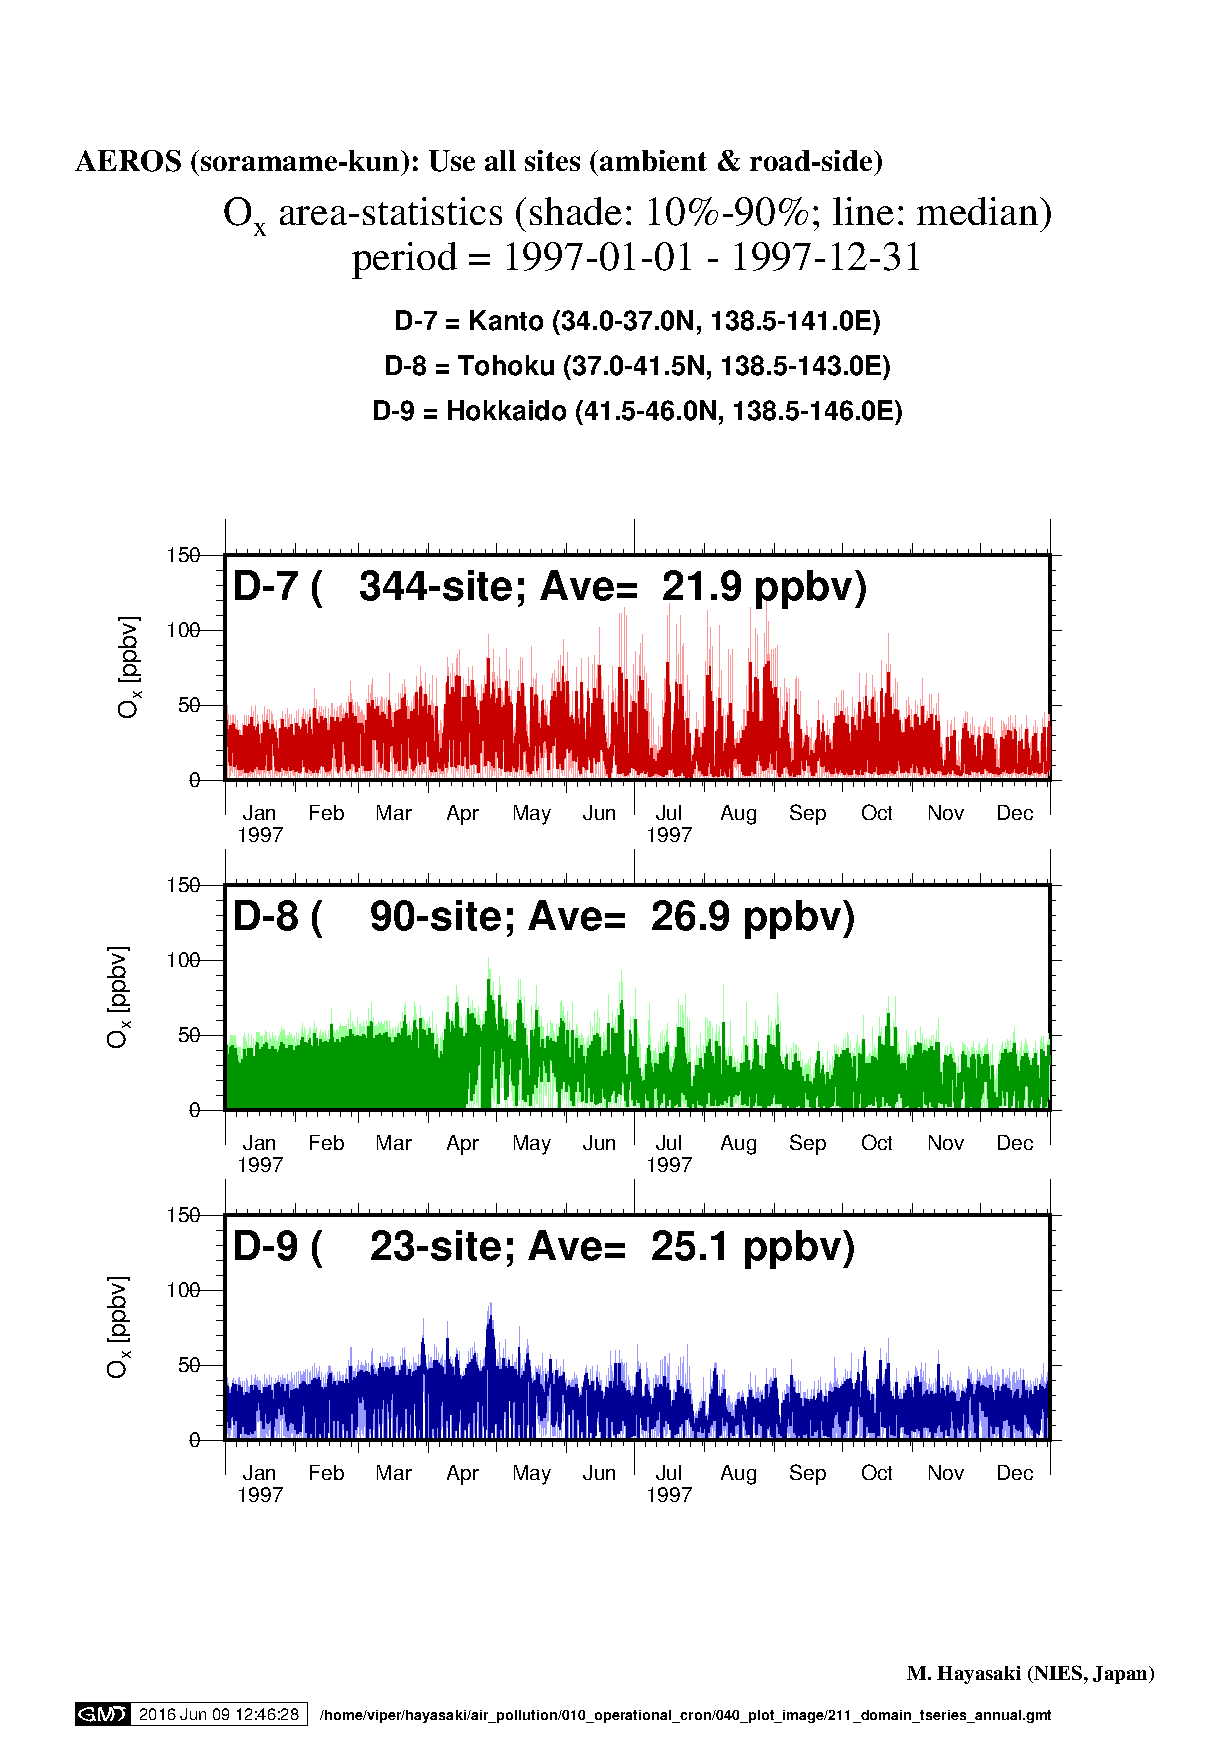
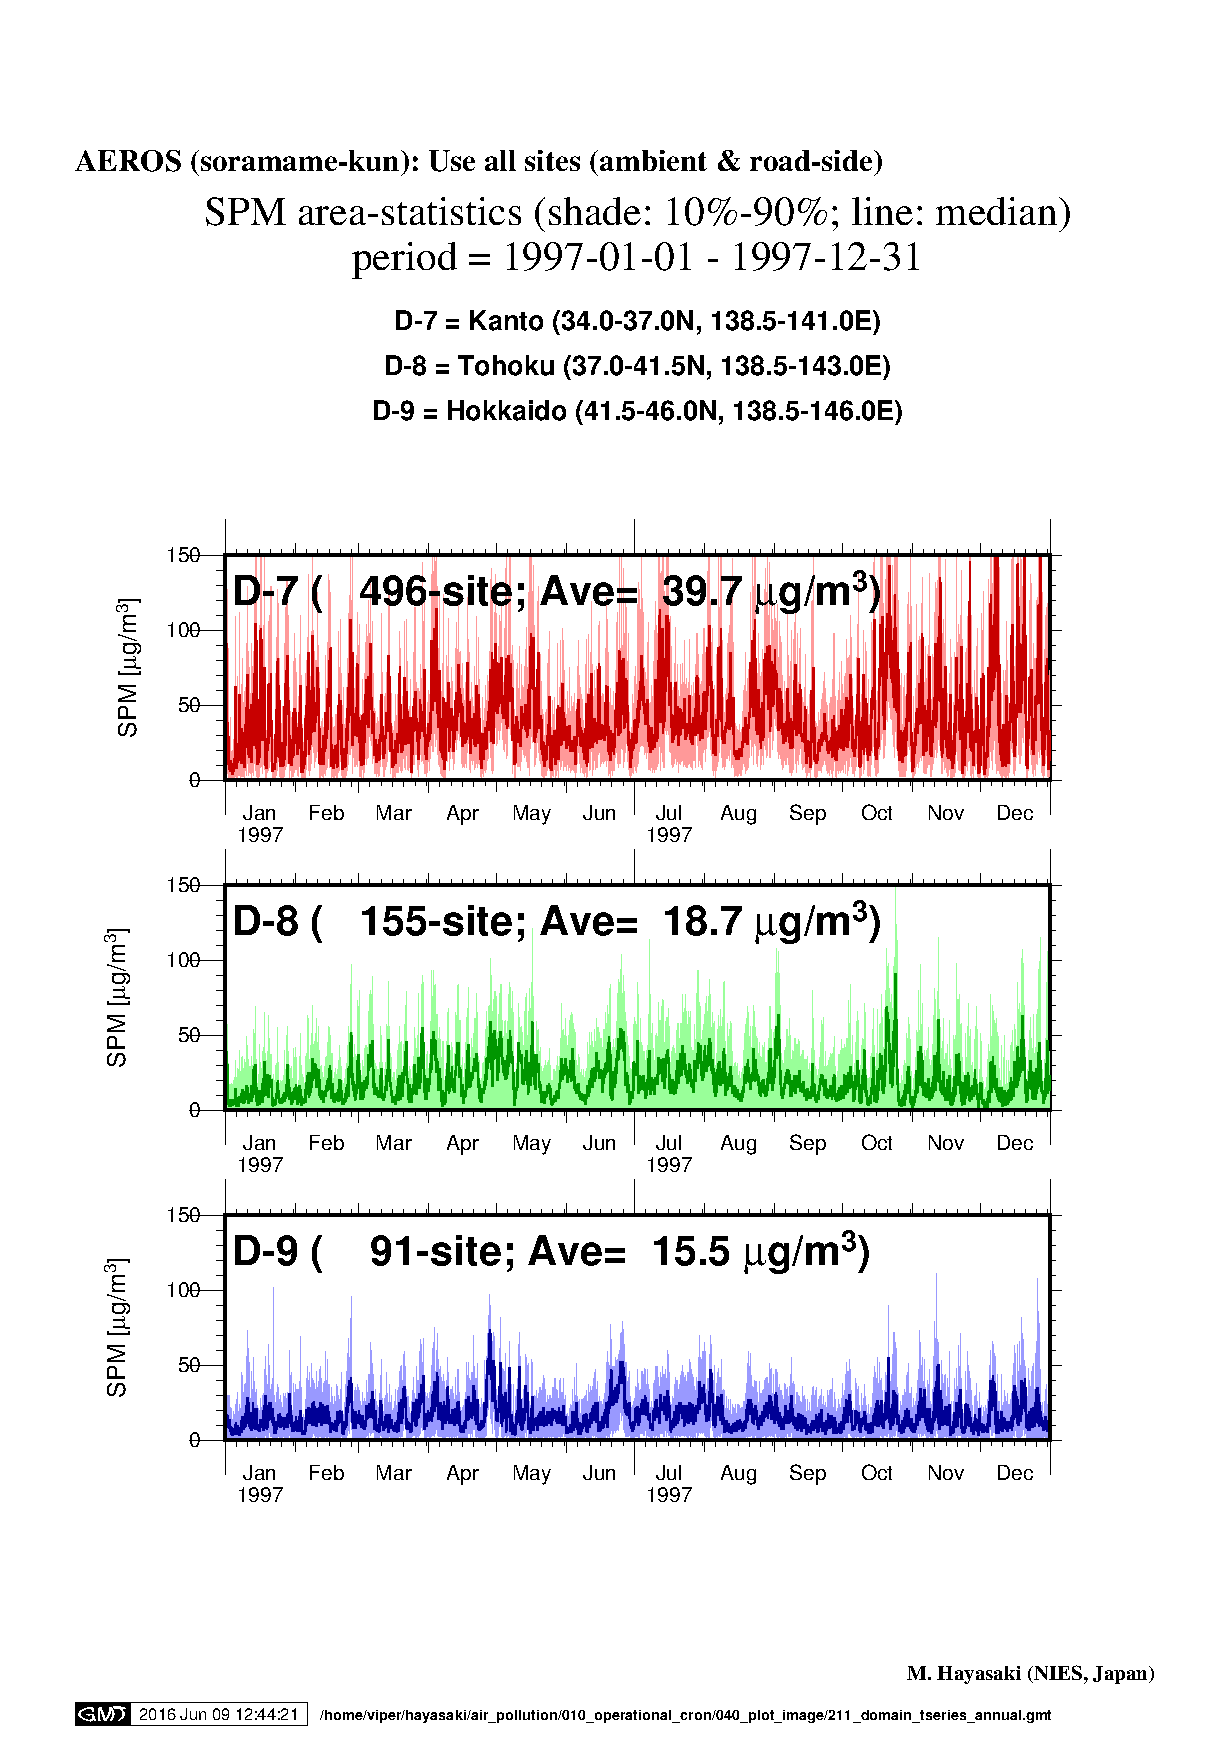
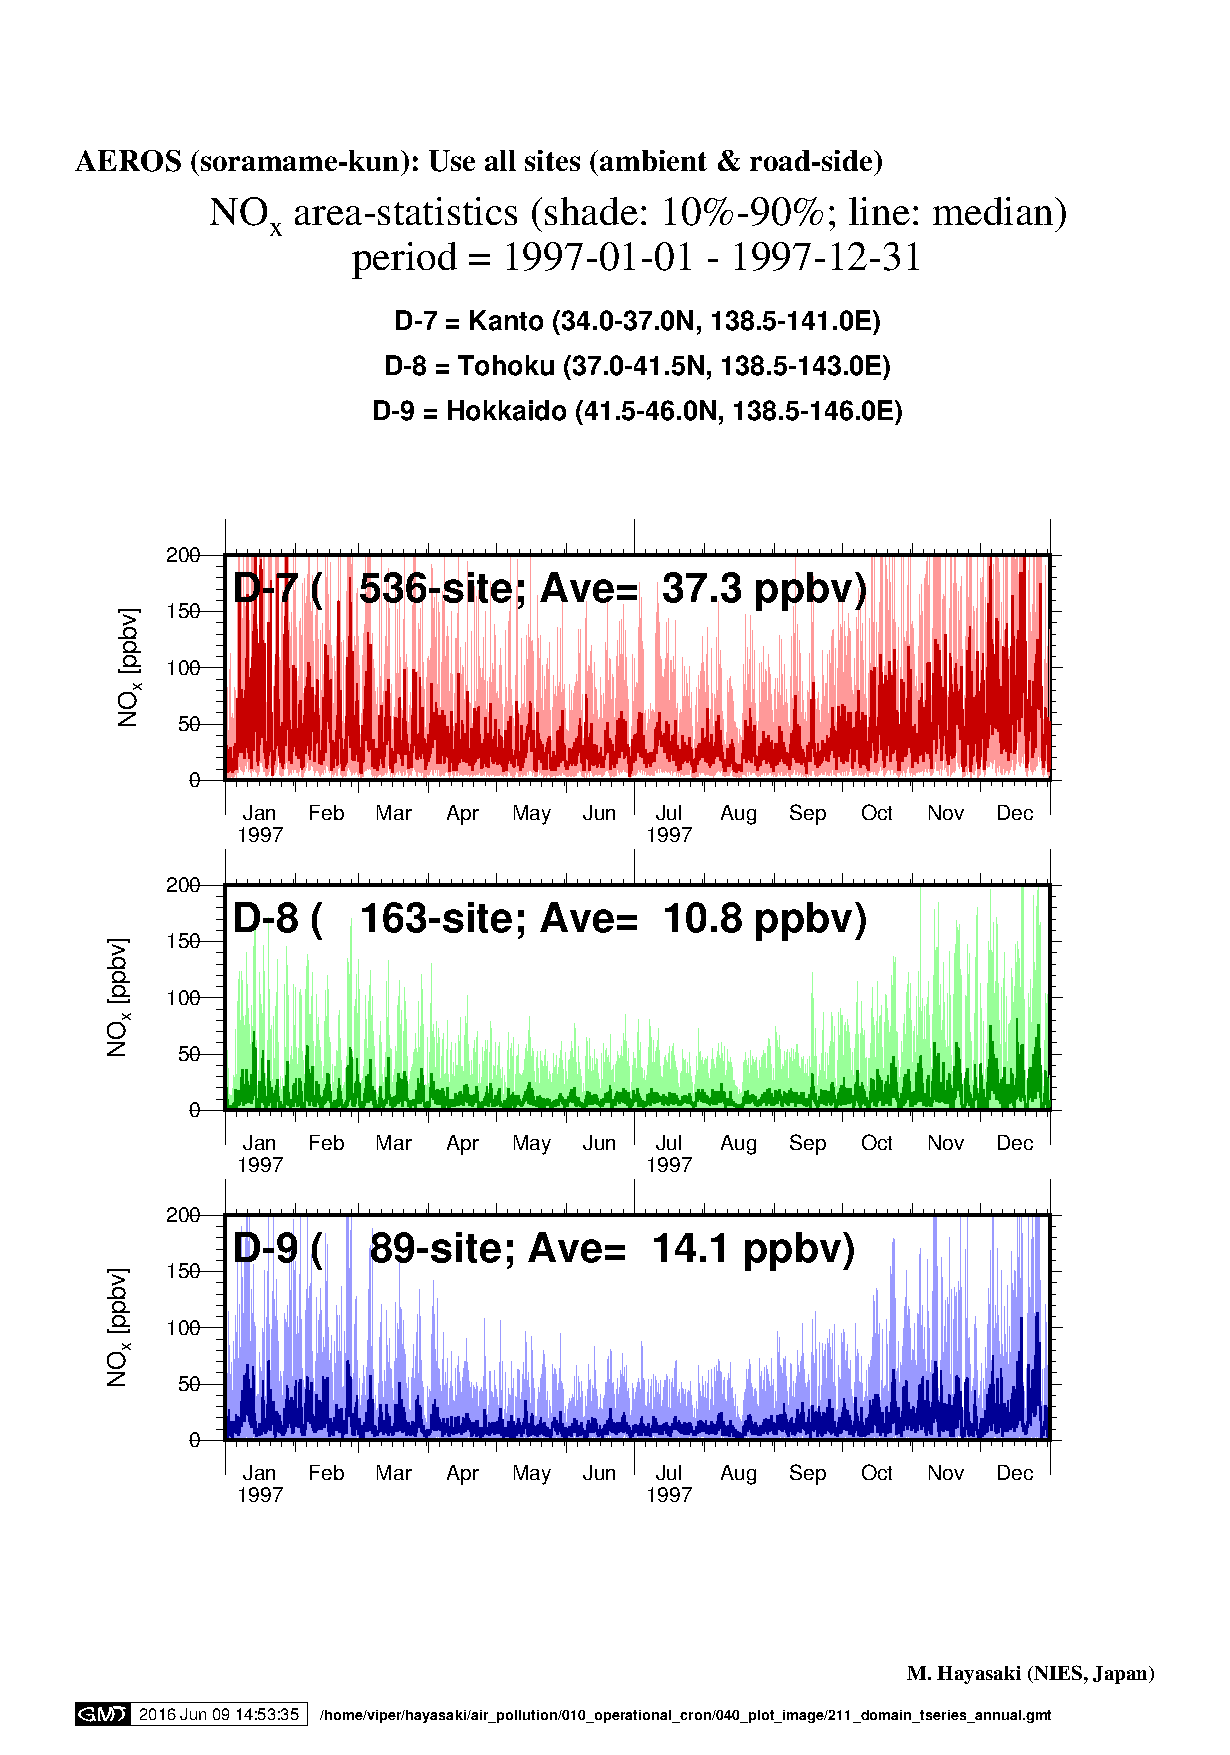
y1997: 領域内Ox, SPM, PM2.5, NOx濃度時系列(年間,月別)
1997年の領域内汚染物質濃度の時系列. 年間および月ごとの時系列図を用意.
This PHP file was generated by ~/public_html/air_pollution/domain_stat/120_mk_thumb.sh.
1997年全体
- Image filename = 211_domain_tseries_vVV_annual_YYYY_pPP.png
- Plot script = (AP_opr)/040_plot_image/210_exec_tseries_fig.sh
- Call 211_domain_tseries_annual.gmt inside the shell script mentioned above.
- Update the latest two years at 04:45JST (19:45UTC).
- See also SPM, PM2.5高濃度 (1997年)(if avail)
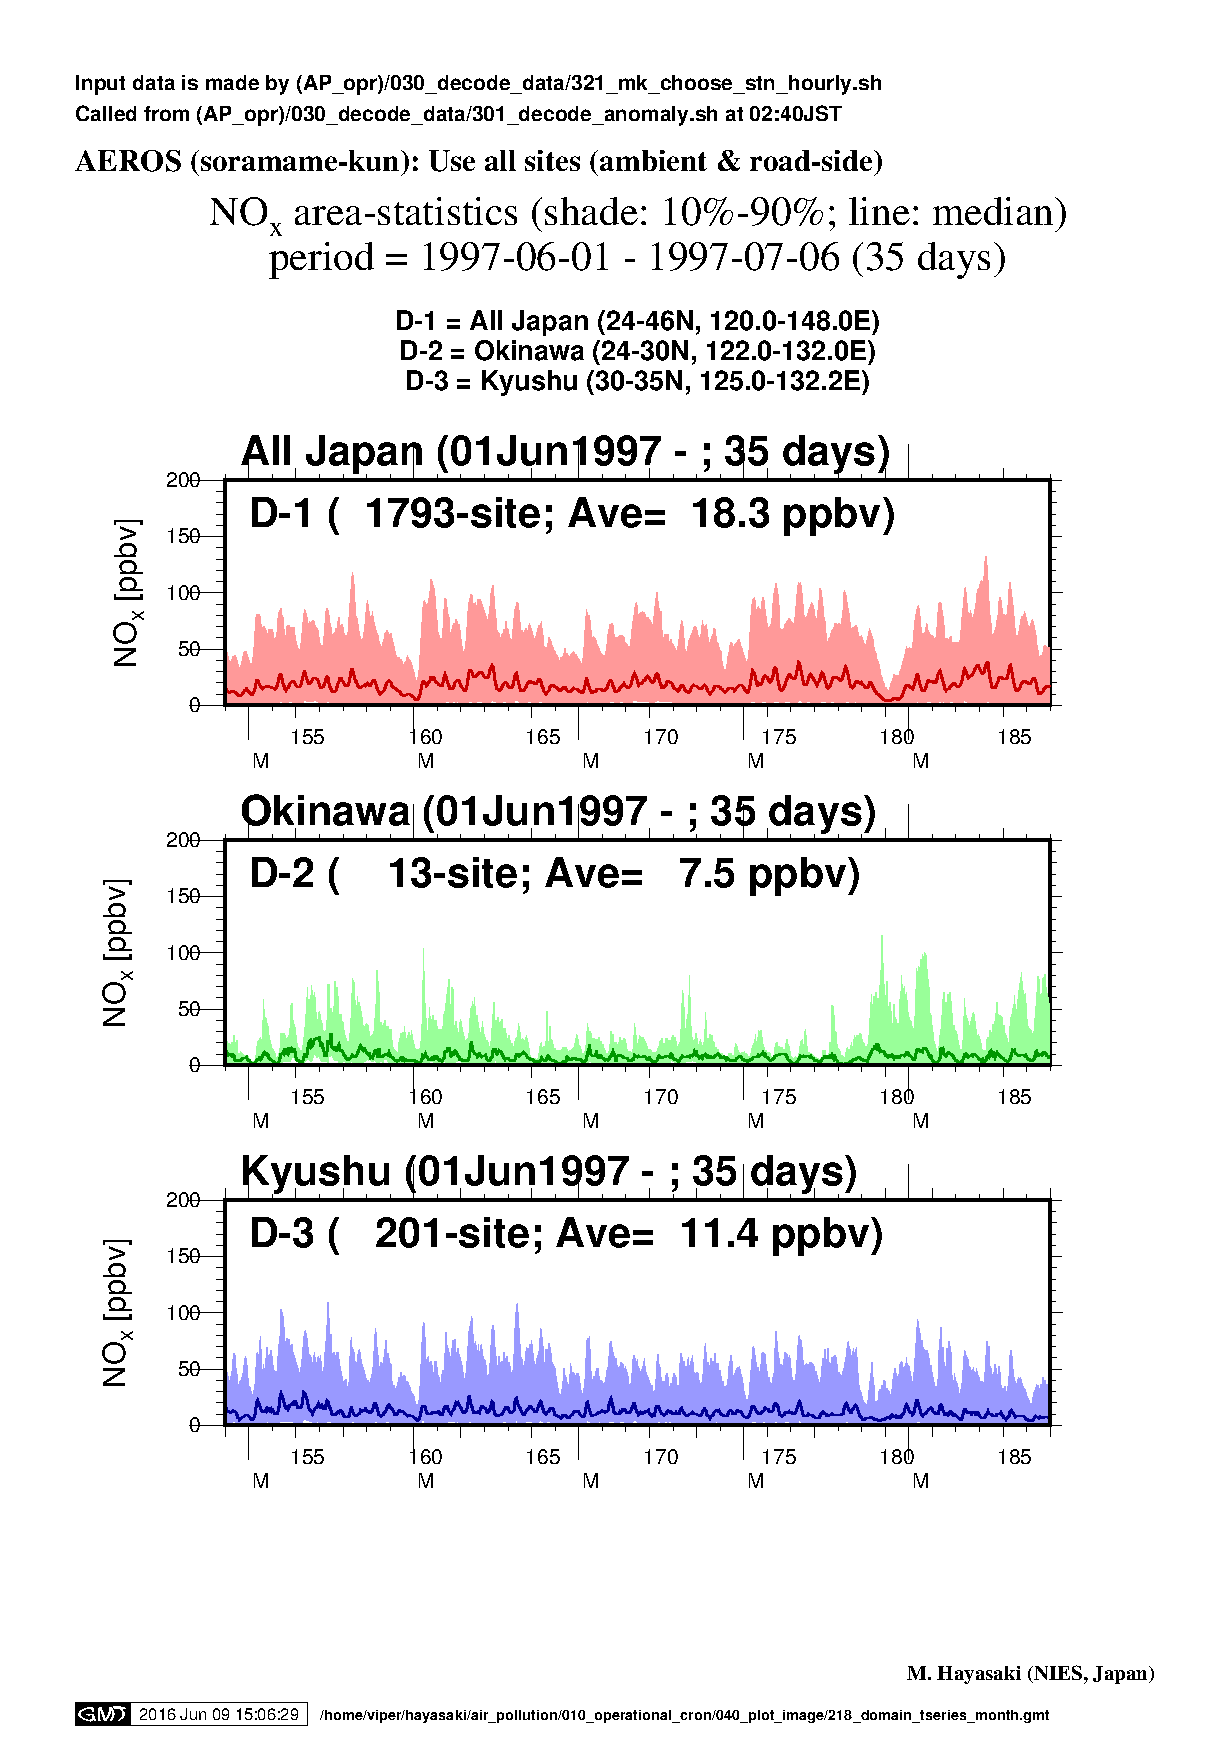
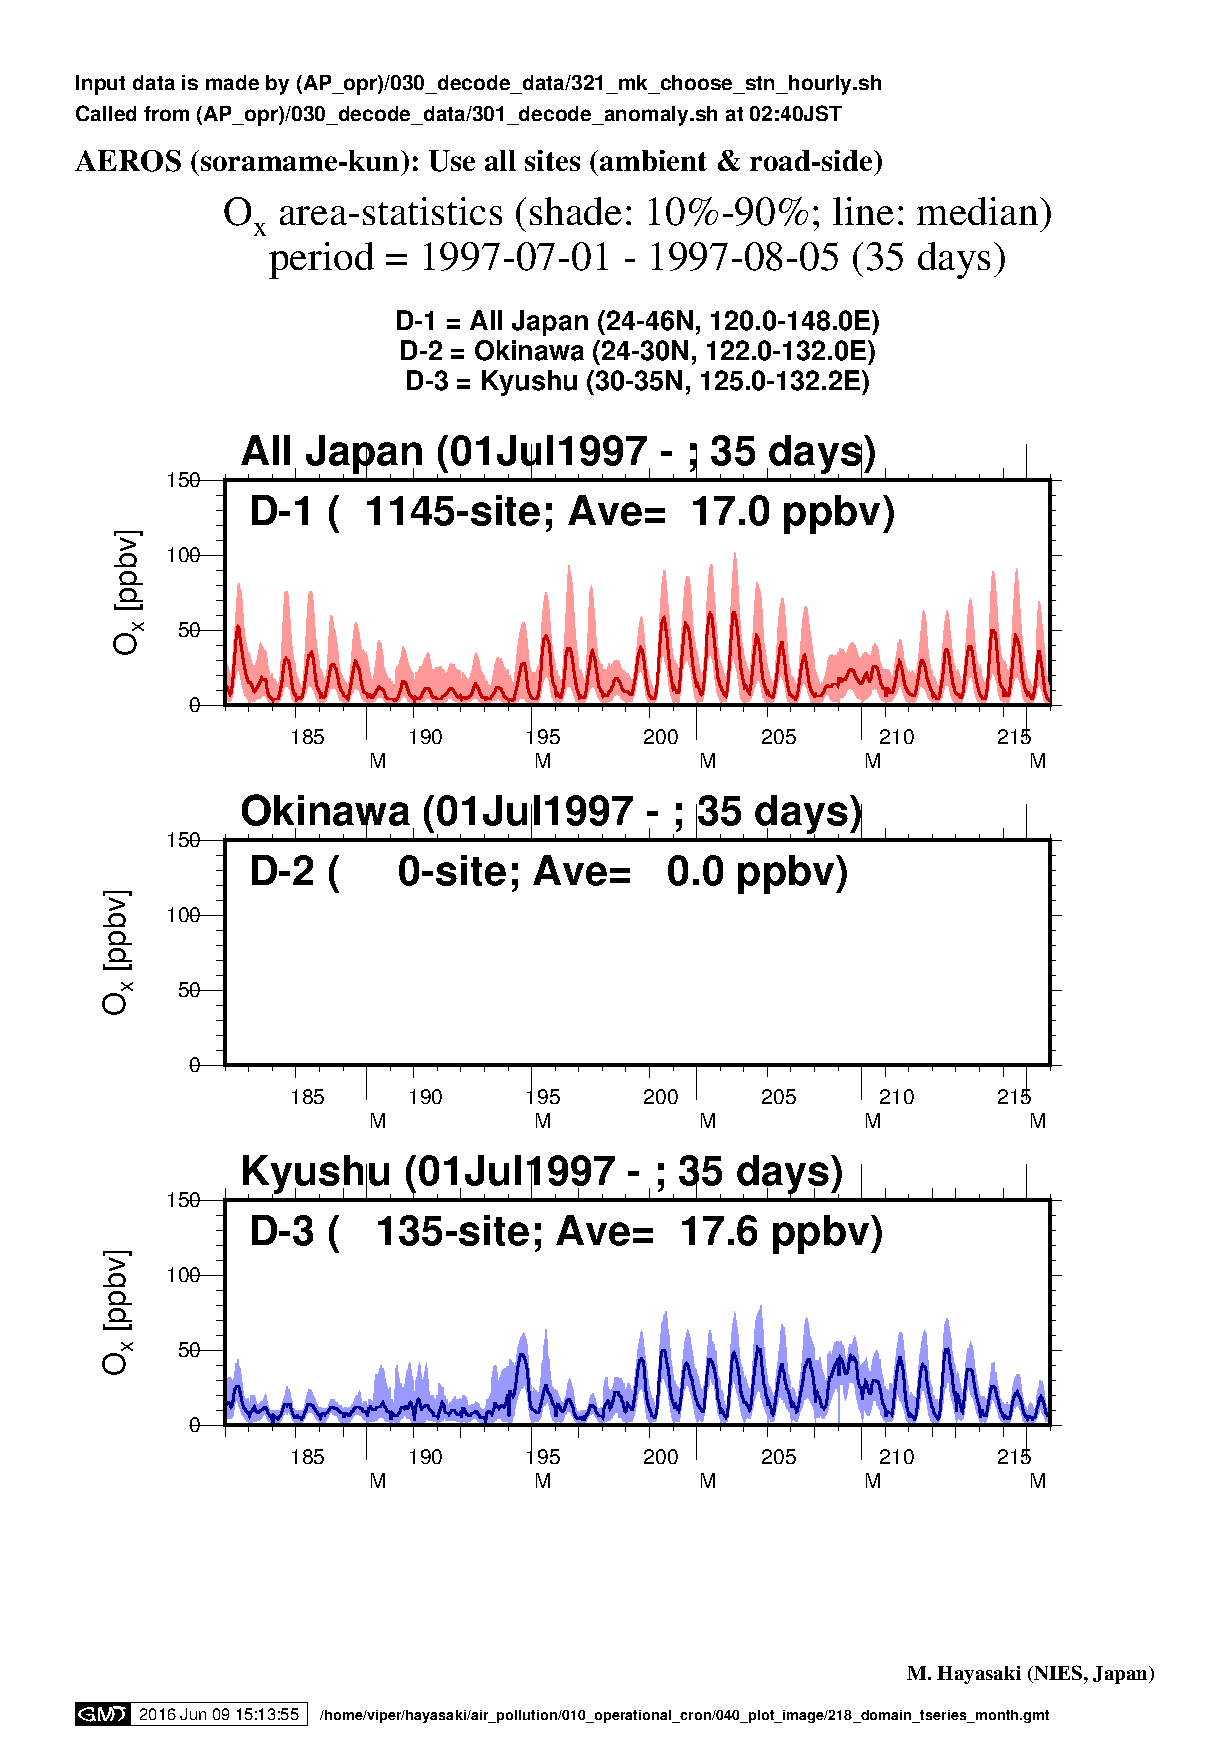
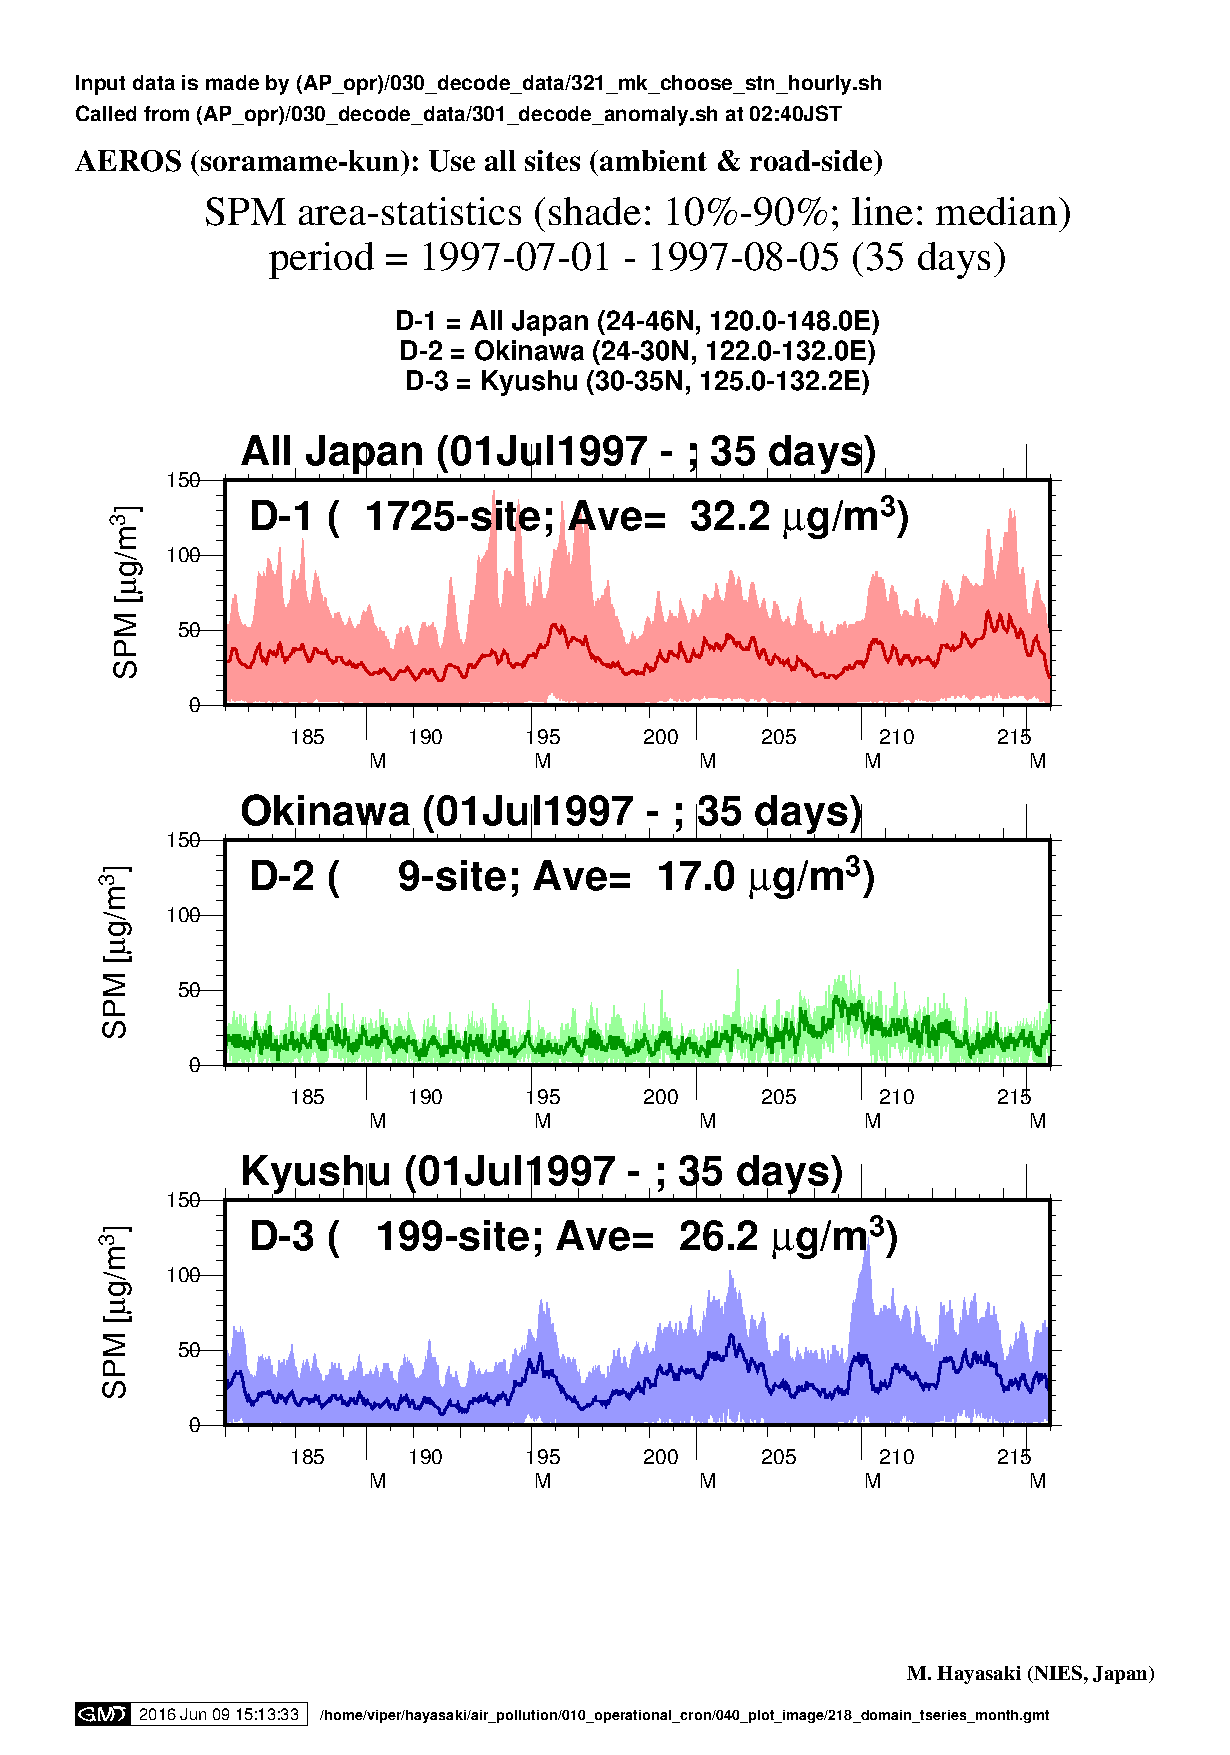
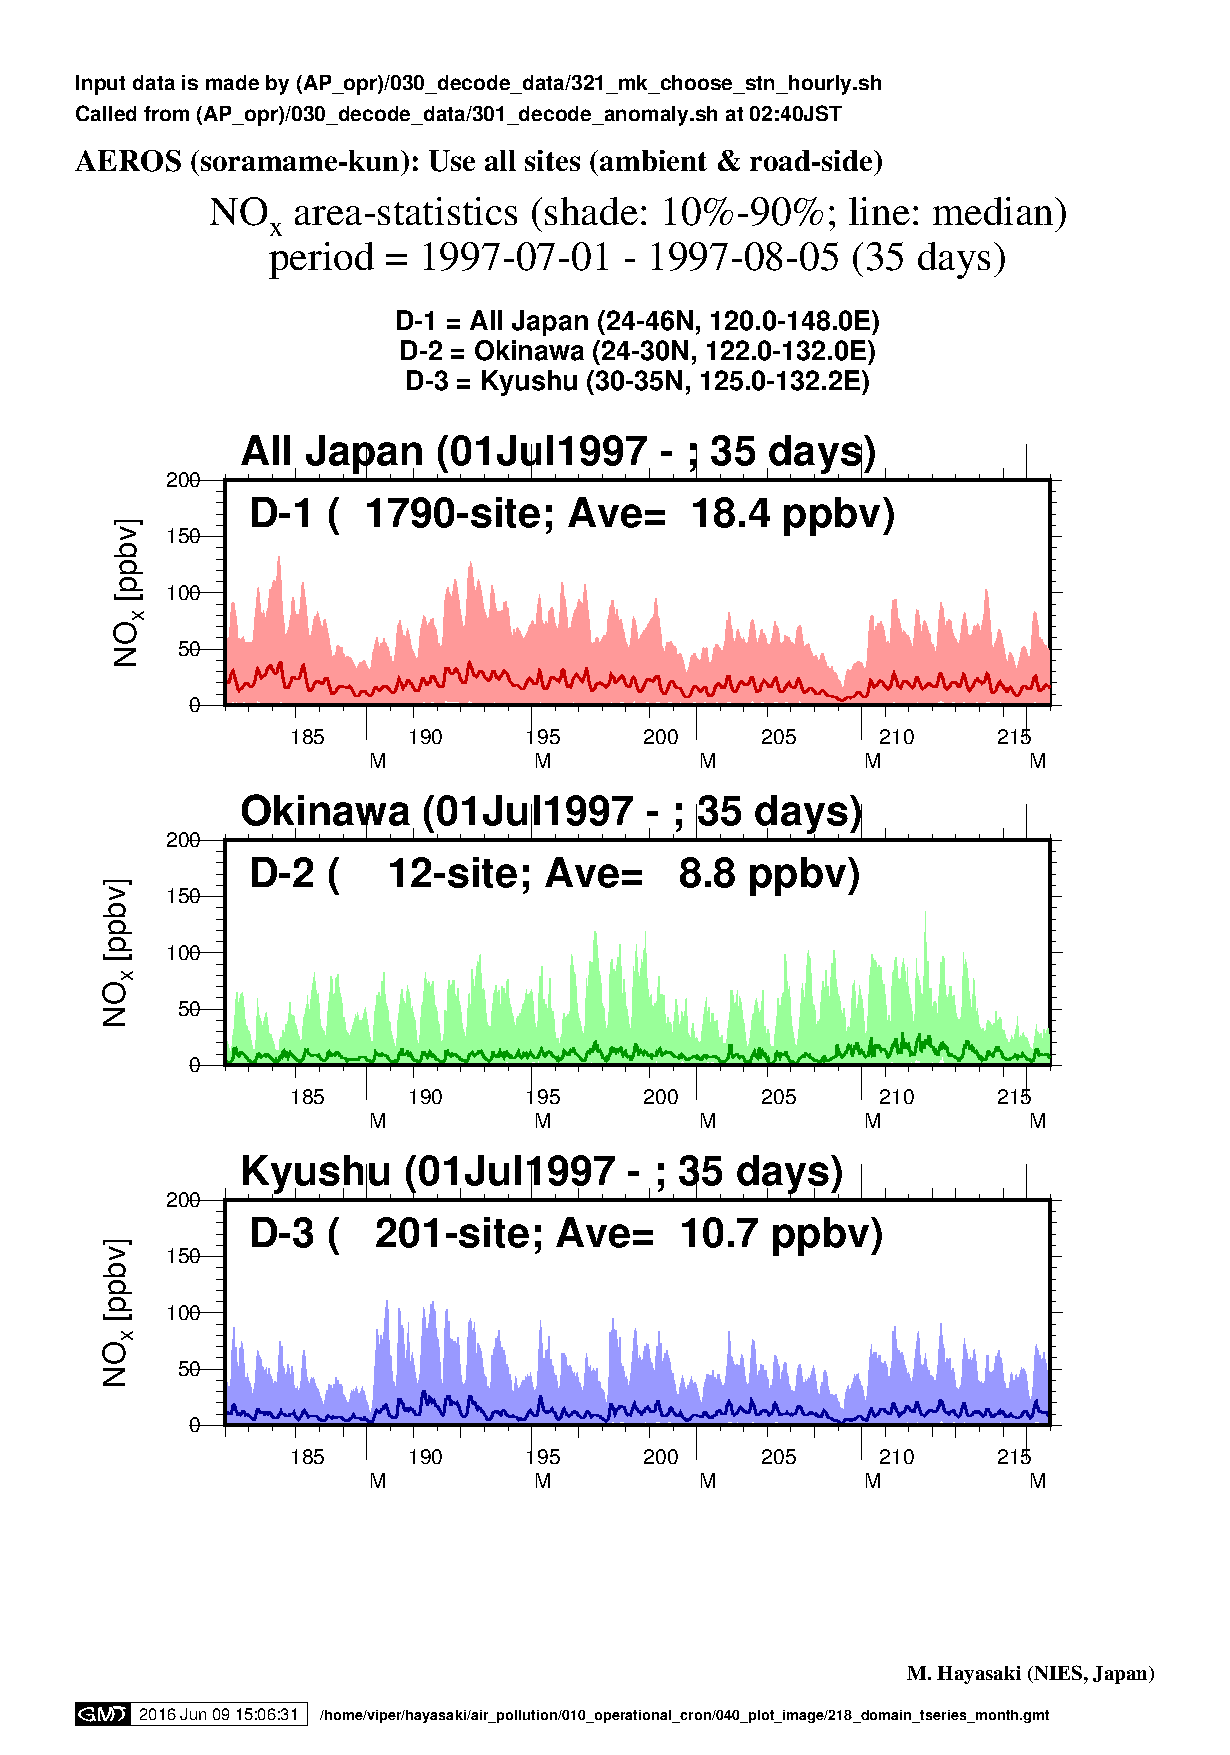
各領域内のOx, SPM, PM2.5 濃度のパーセンタイル値. 1枚あたり3領域,日本全体と国内の8領域に分割. 領域区分は,領域設定・統計値計算手順を参照.
| domain | Ox (y1997) | SPM (y1997) | PM2.5 (y1997) | NOx (y1997) |
|---|---|---|---|---|
| Domain 1 - 3 (y1997) |
|
|
NA |
|
| Domain 4 - 6 (y1997) |
|
|
NA |

|
| Domain 7 - 9 (y1997) |
|
|
NA |
|
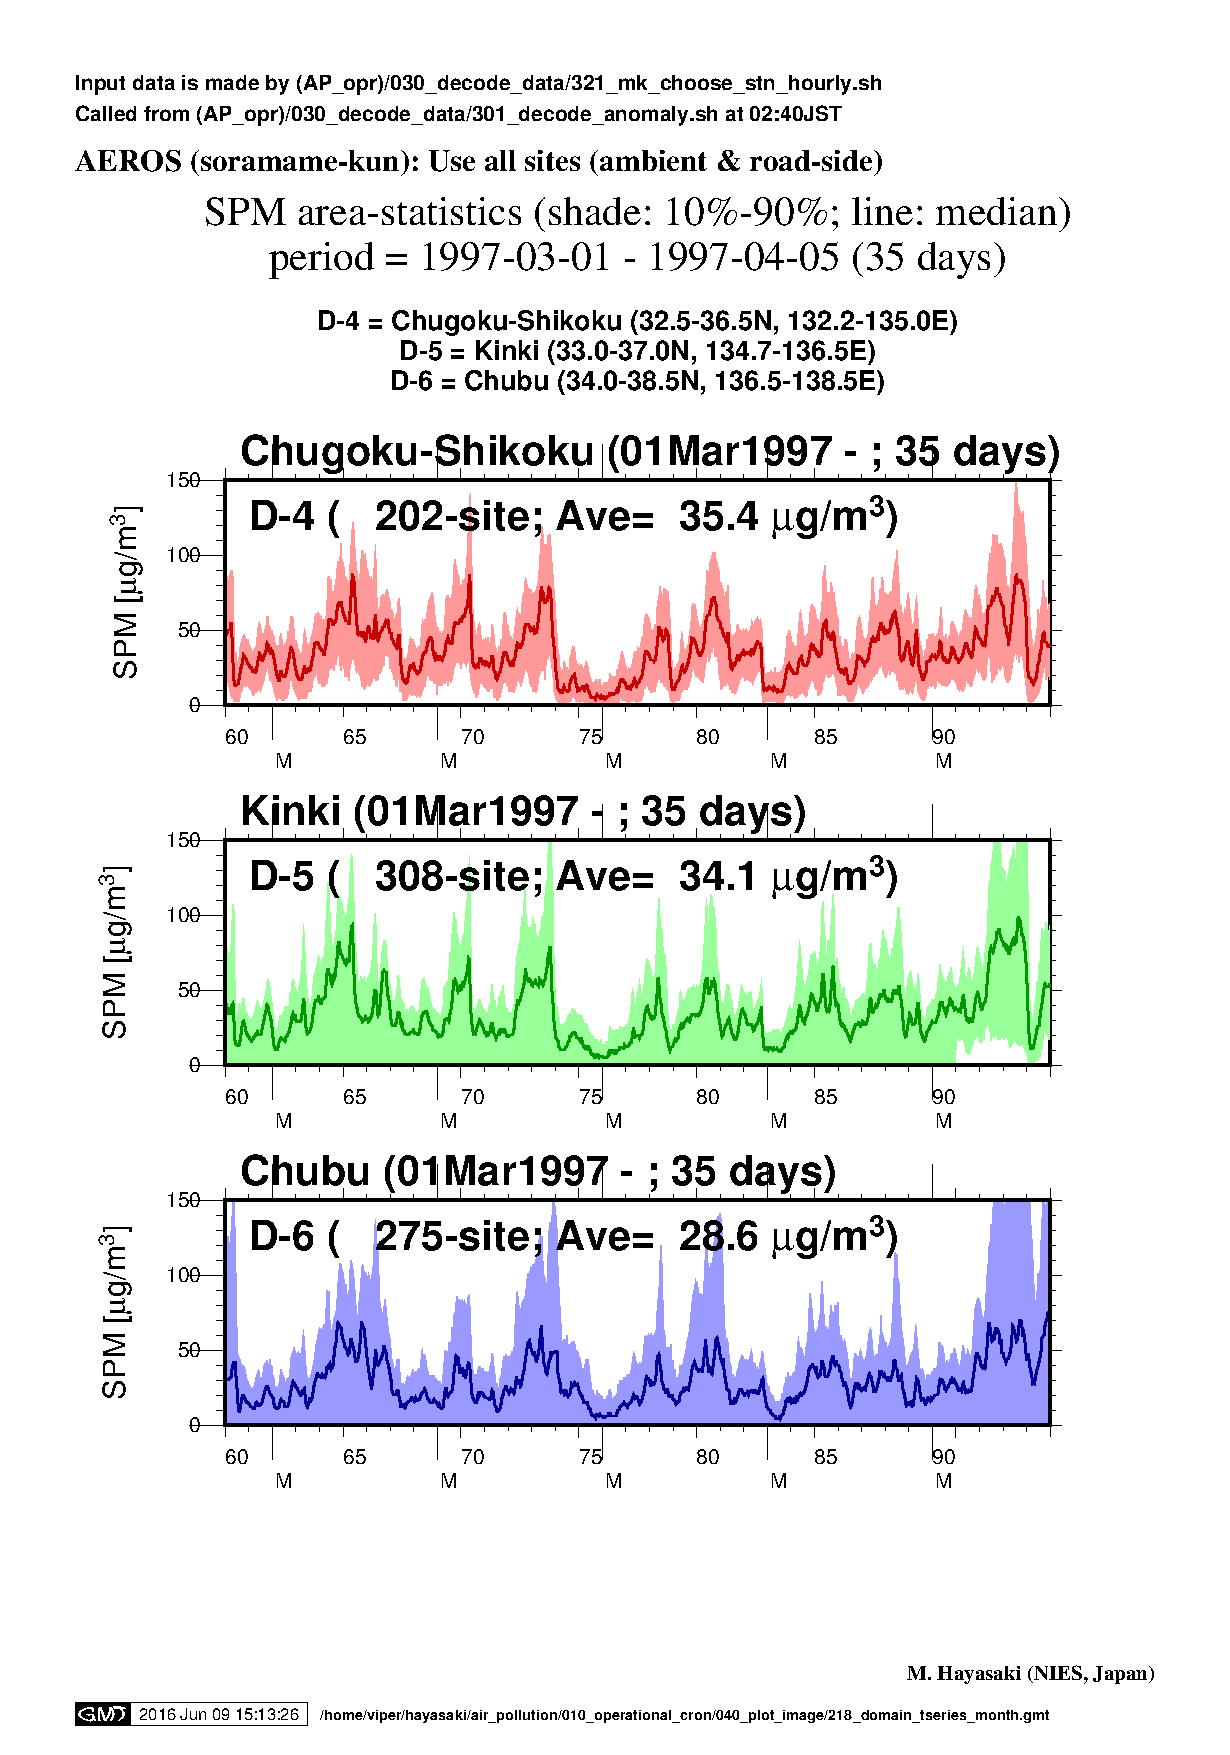
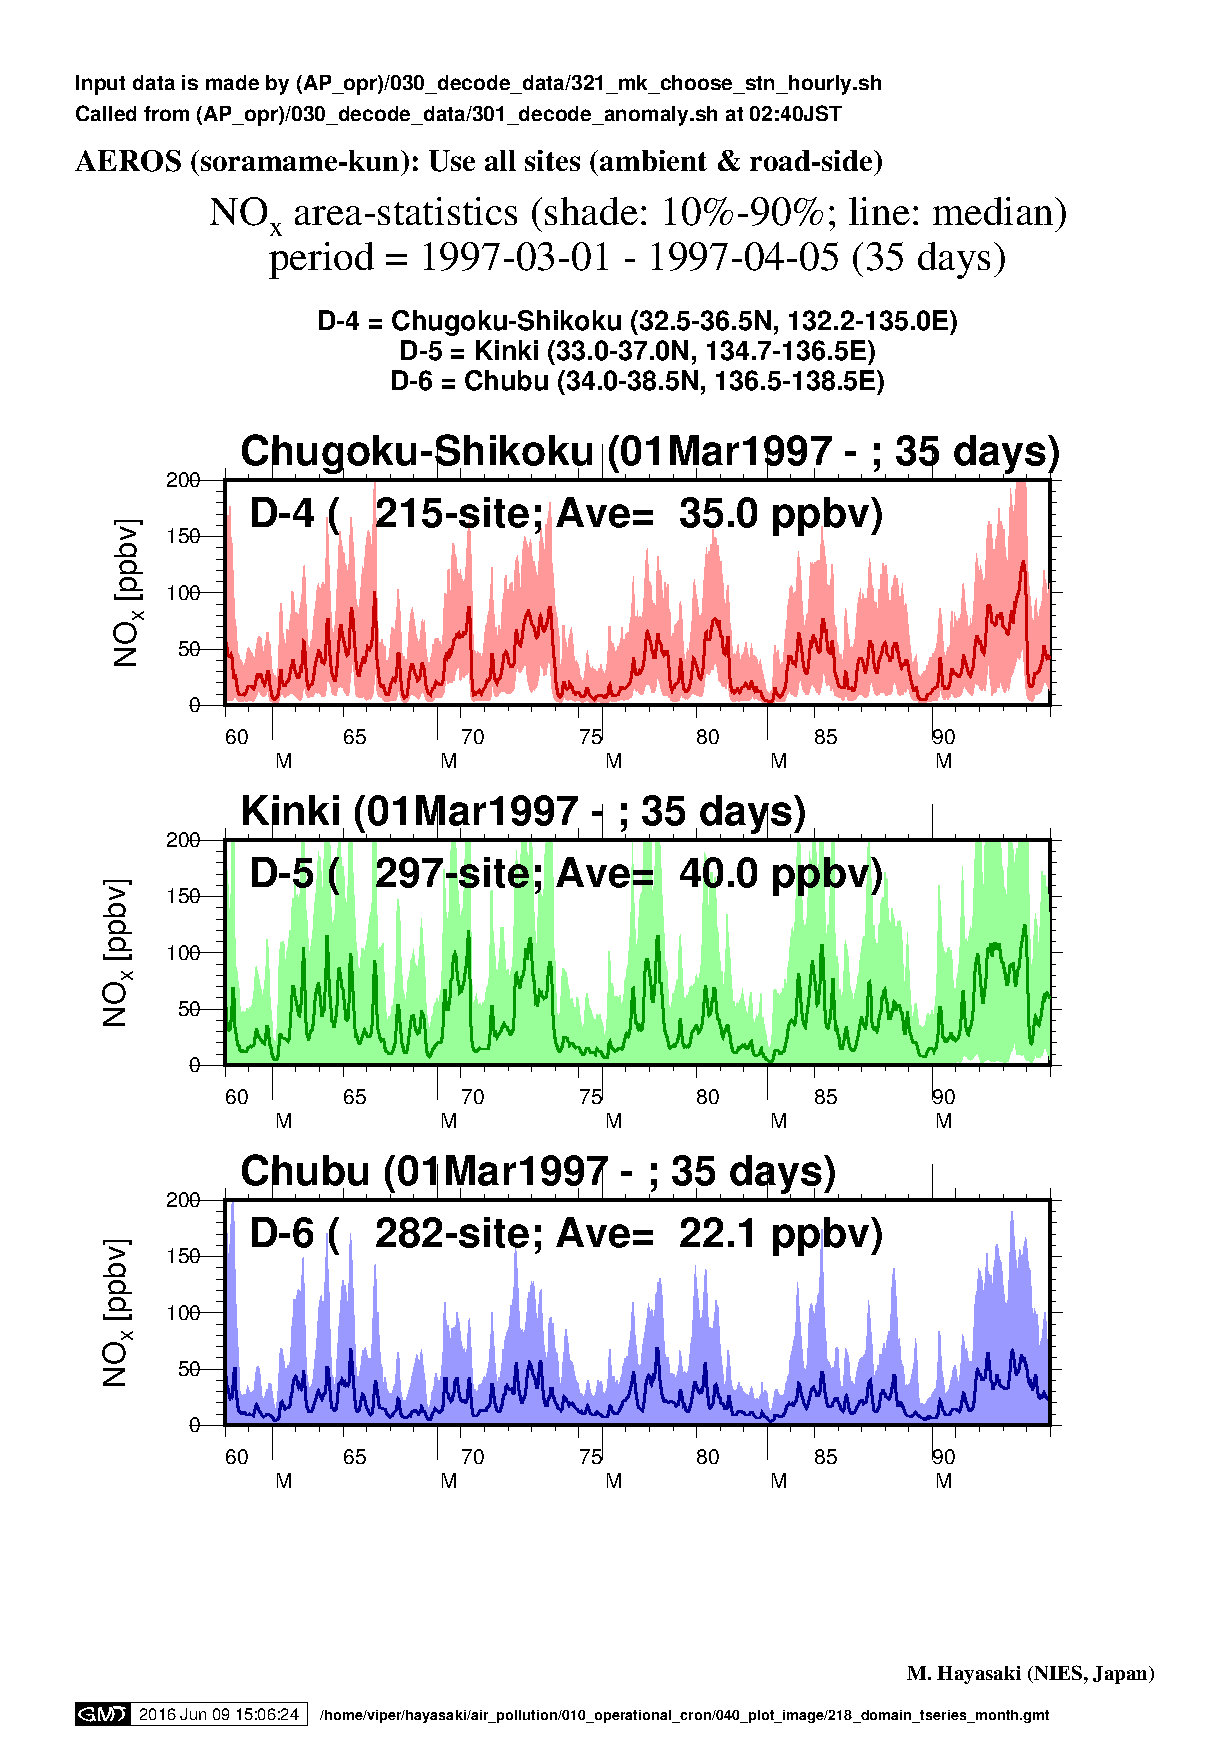
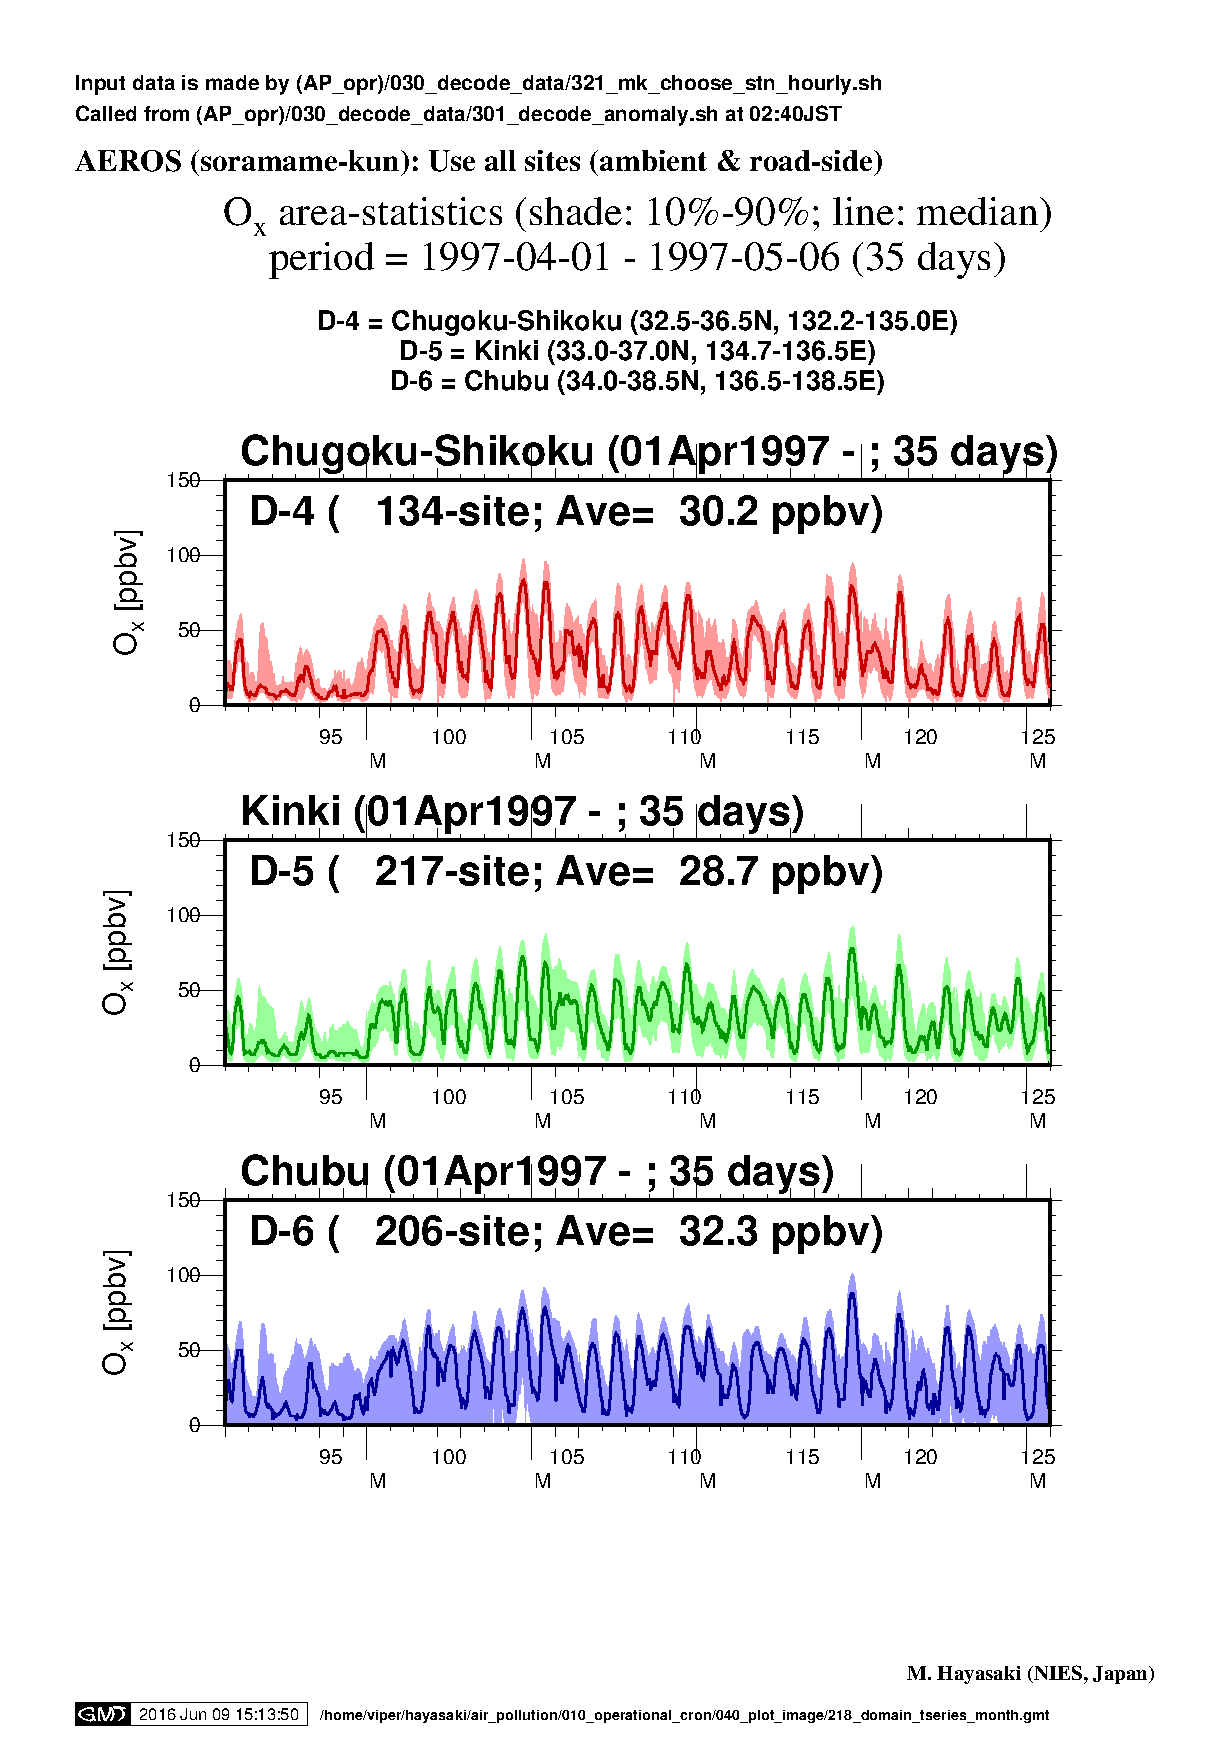
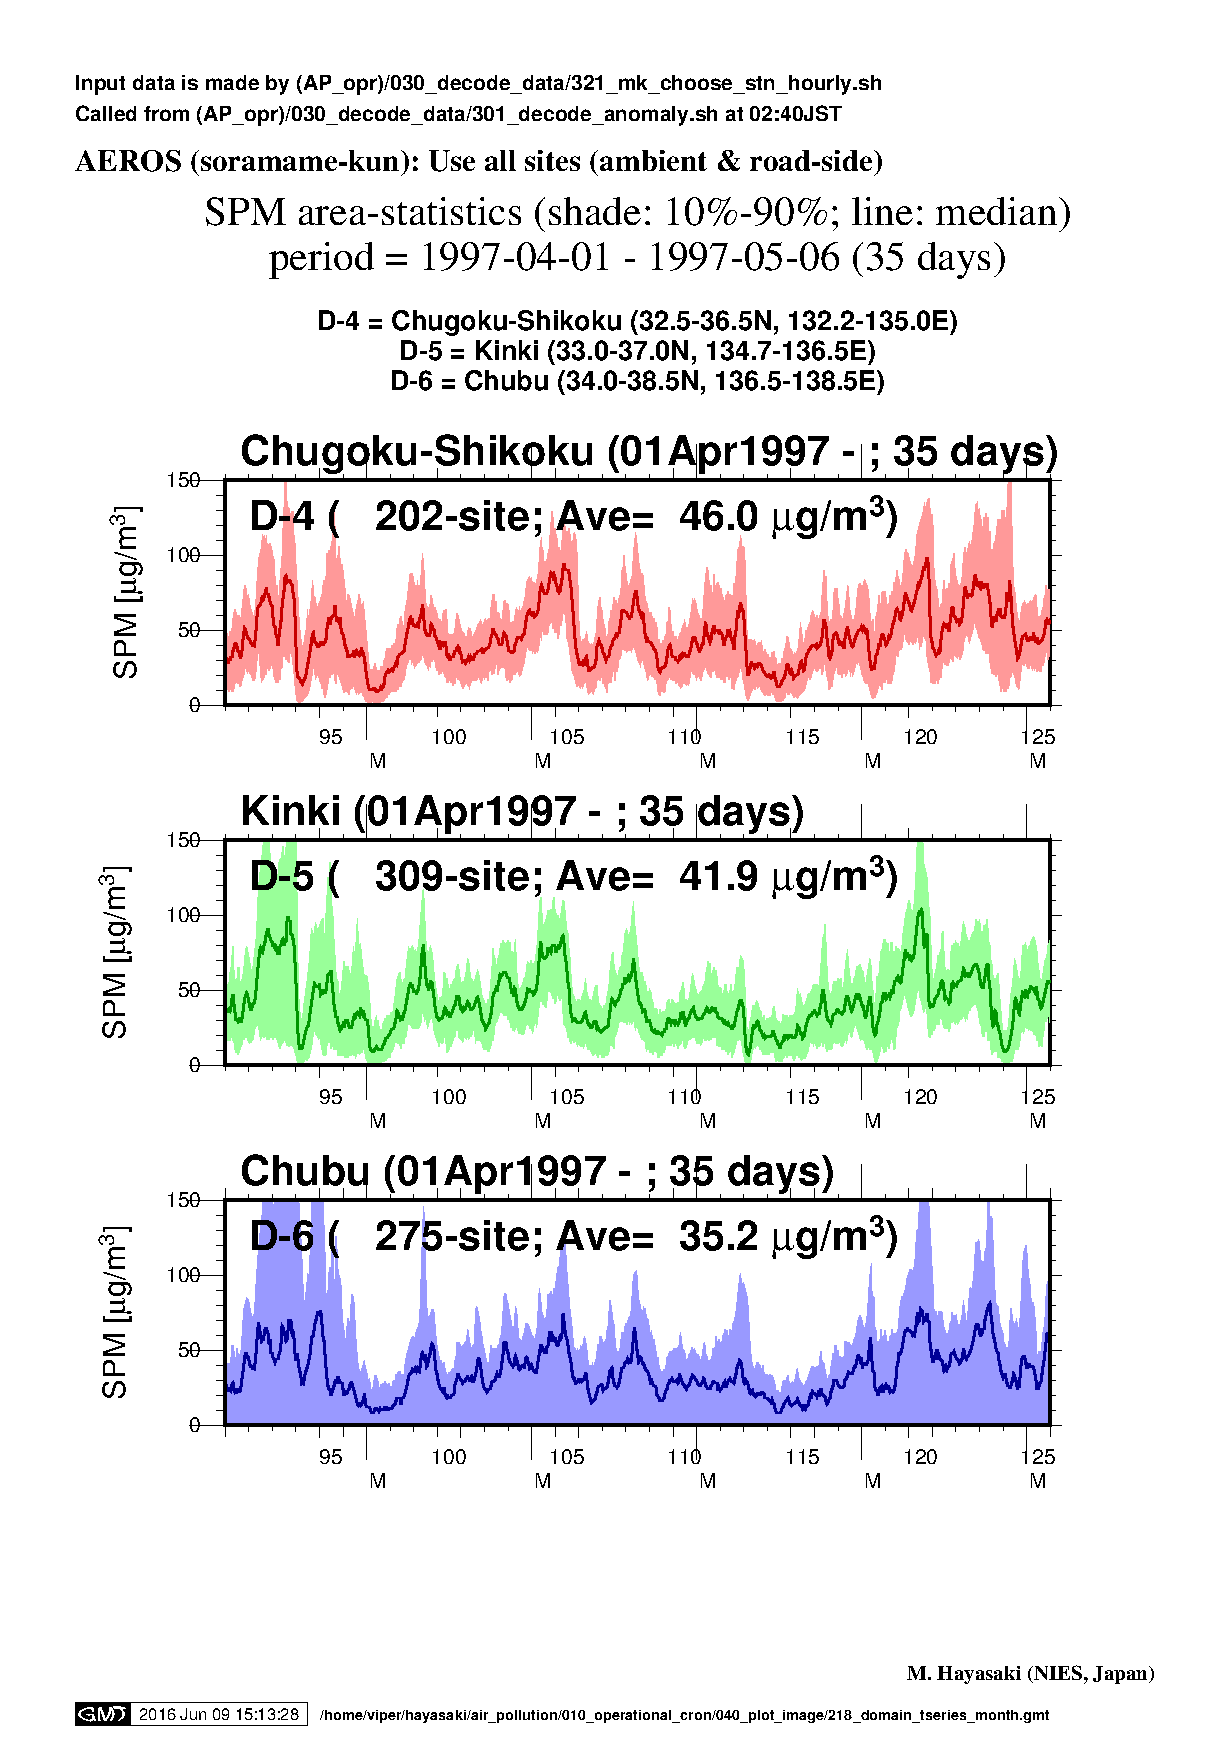
1997年,月別&領域別
- Image filename = 218_domain_tseries_vVV_annual_YYYYMM_pPP.png
- Plot script = (AP_opr)/040_plot_image/210_exec_tseries_fig.sh
- Call 218_domain_tseries_month.gmt inside the shell script mentioned above.
- Update the latest two years at 04:45JST (19:45UTC).
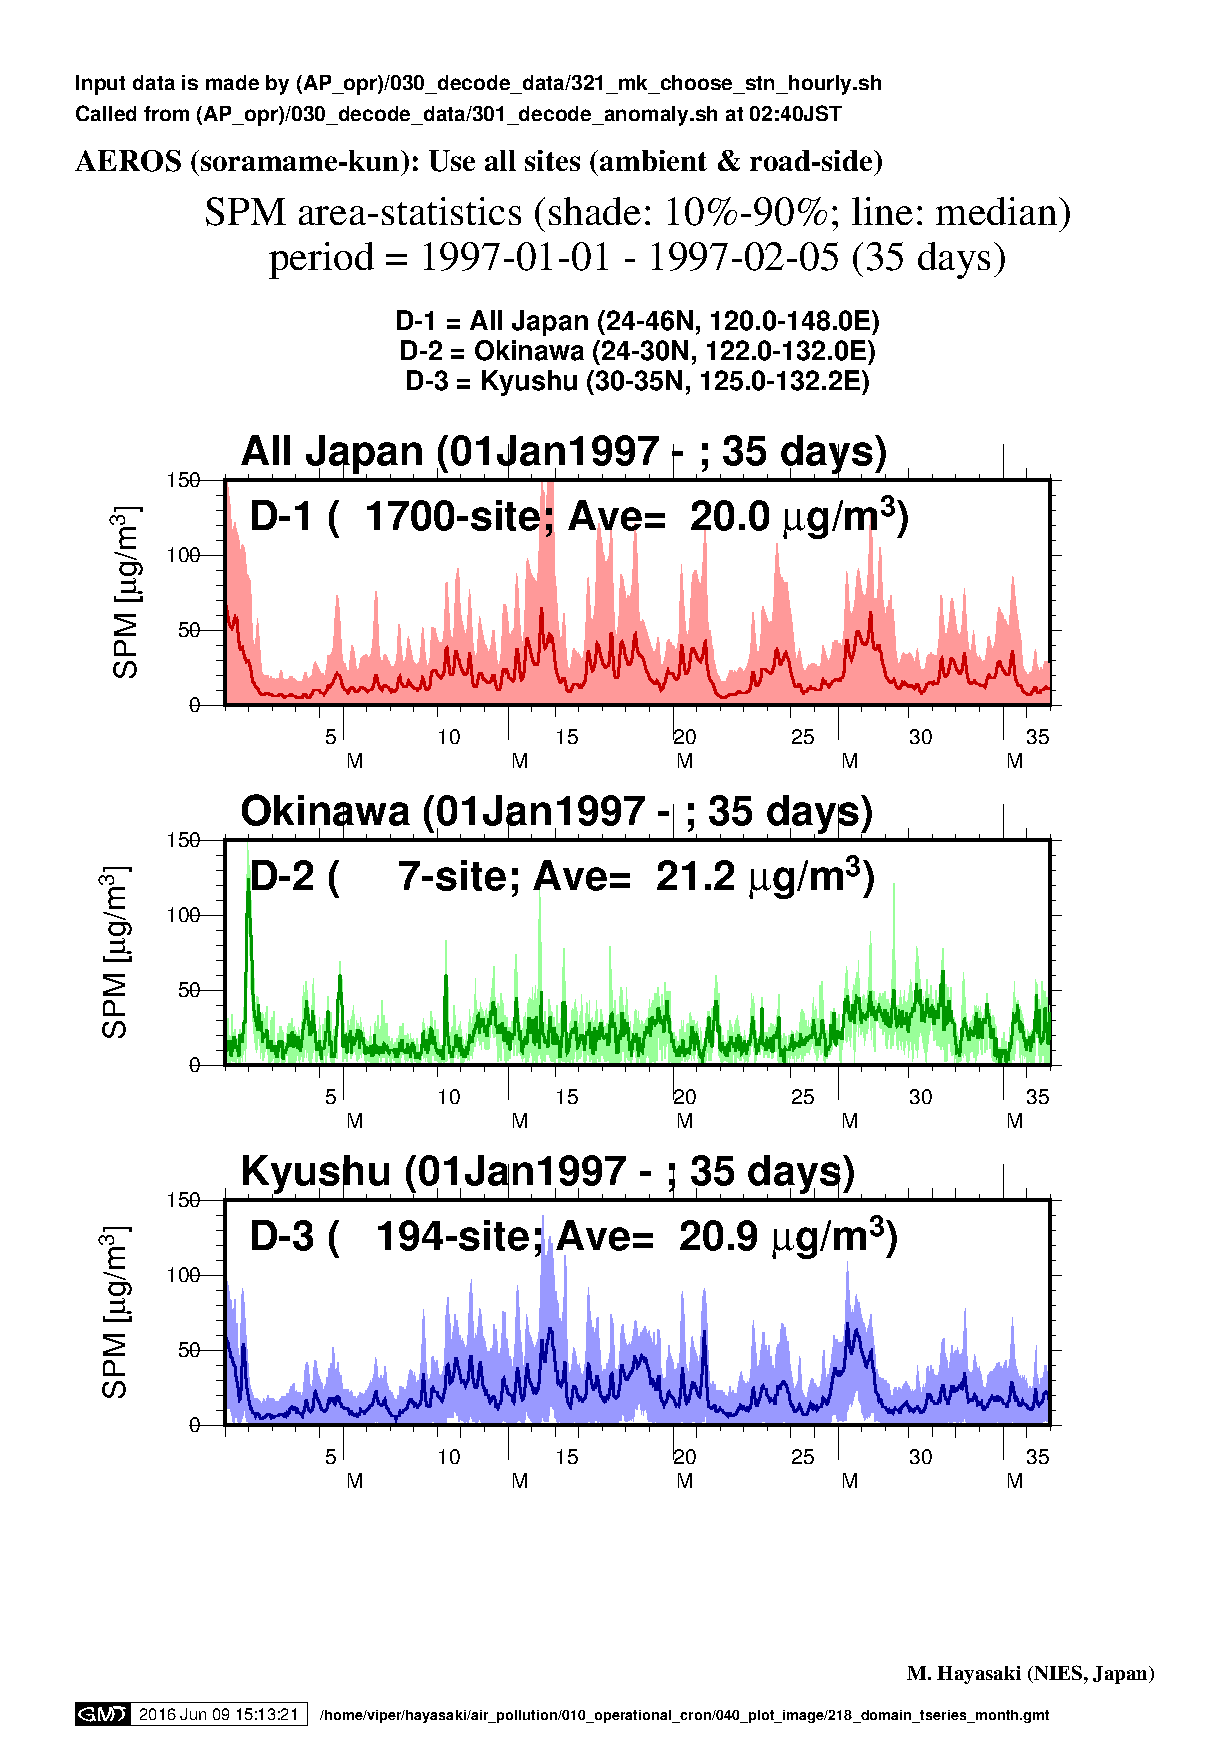
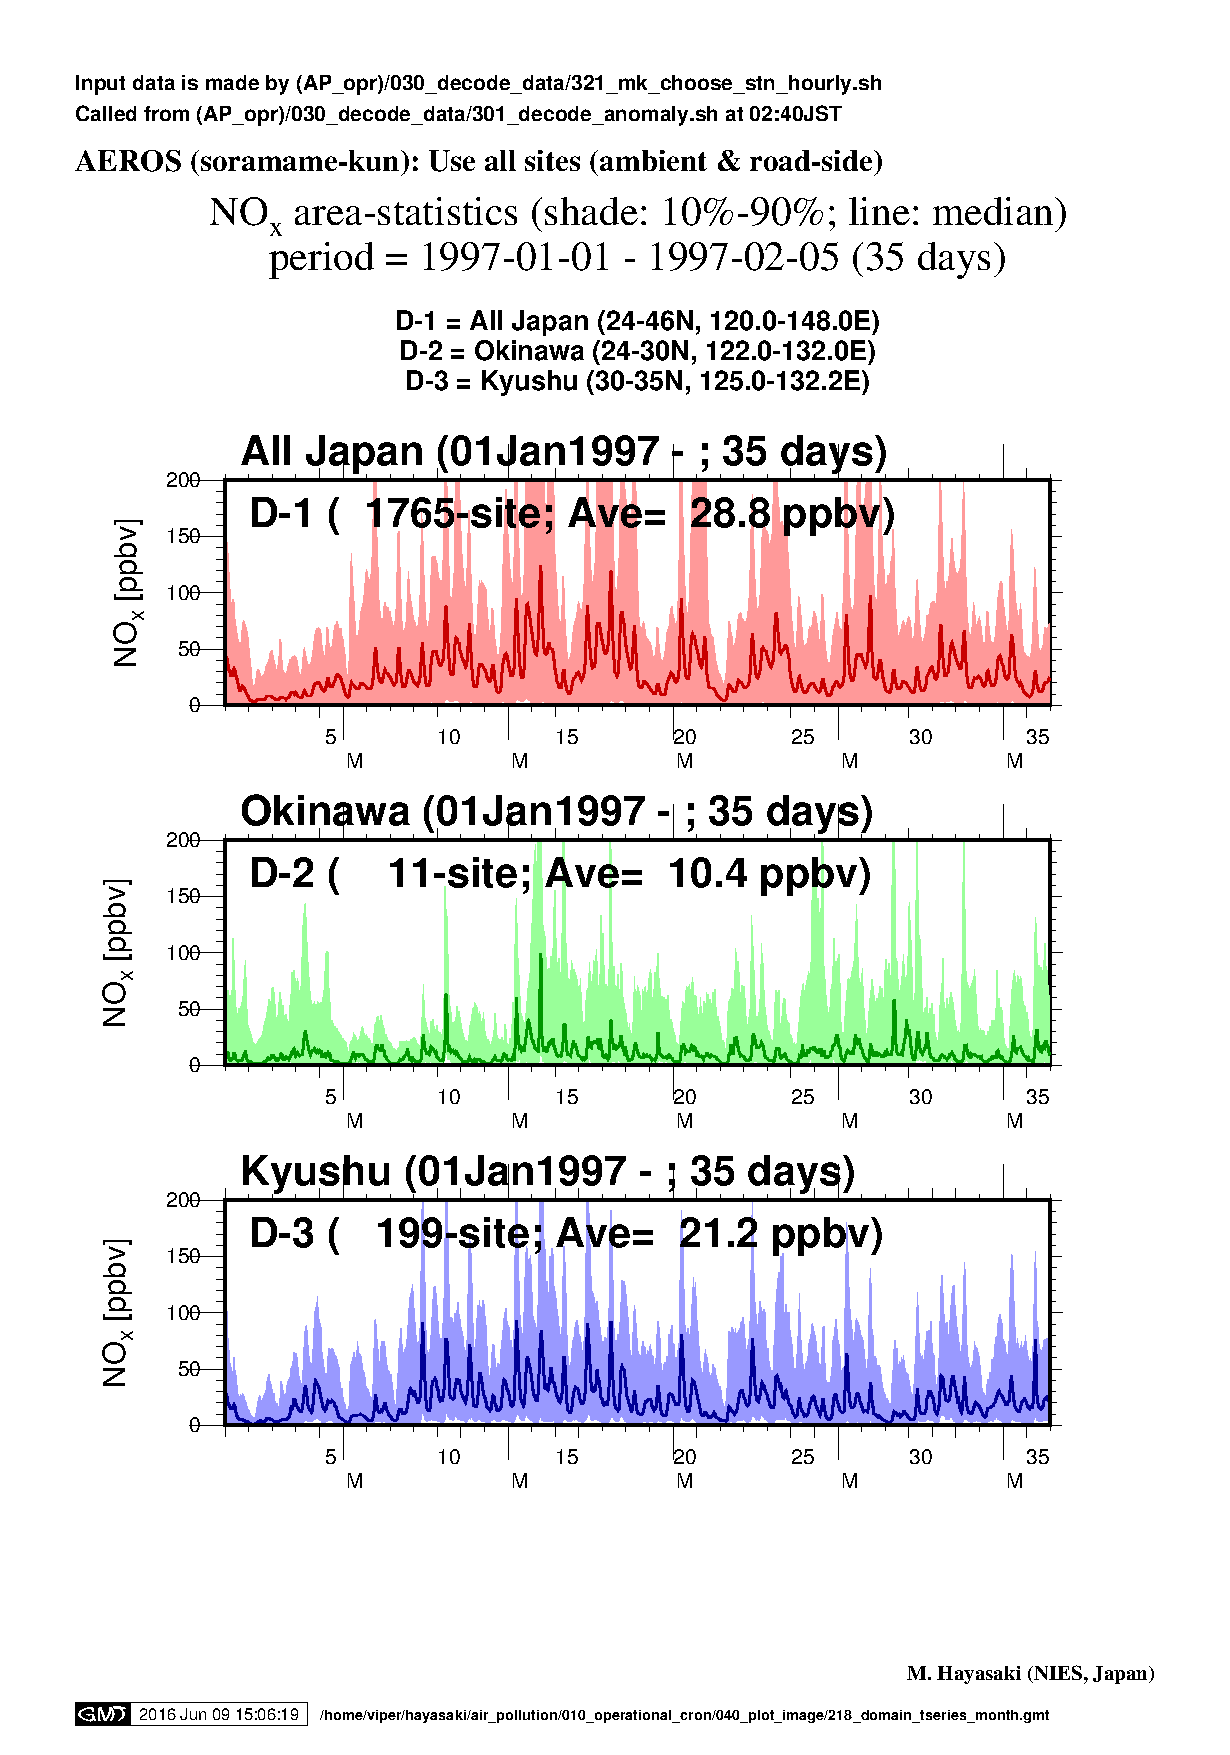
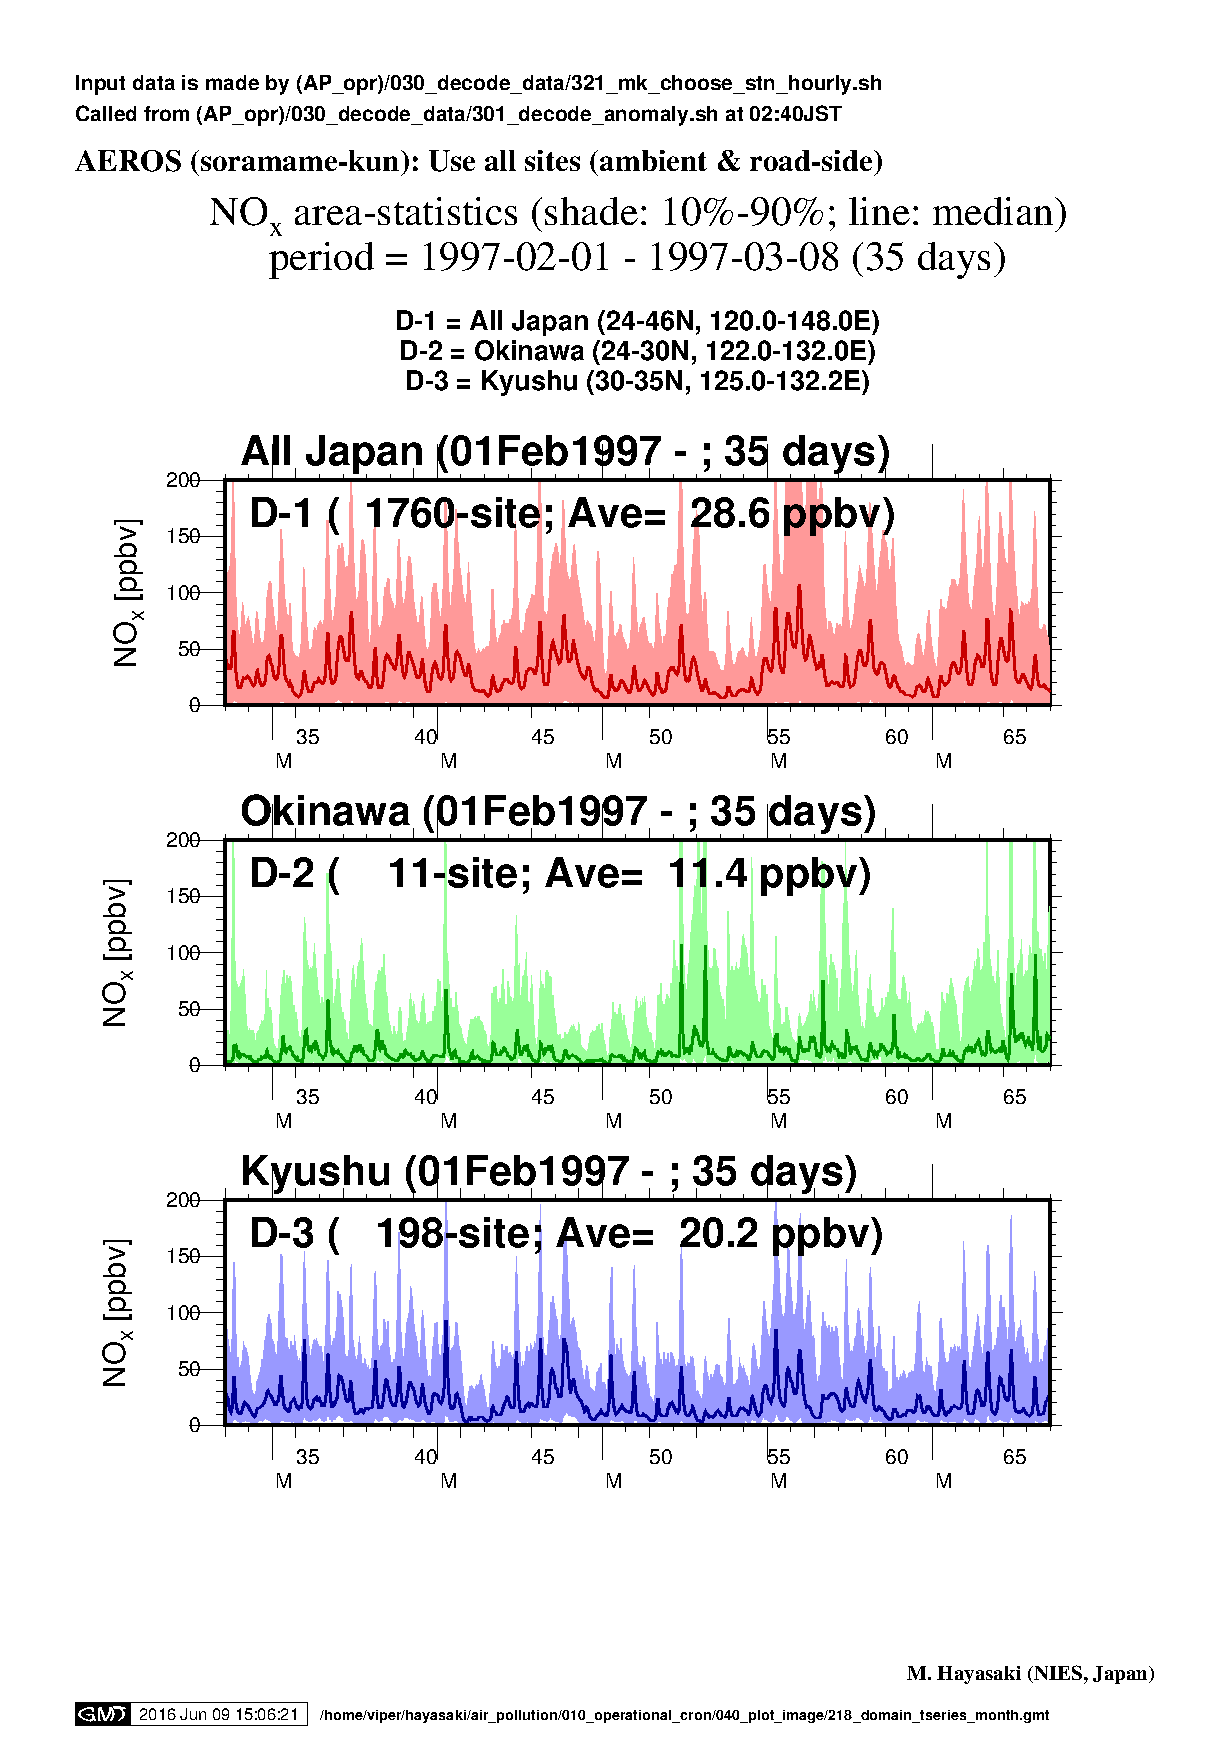
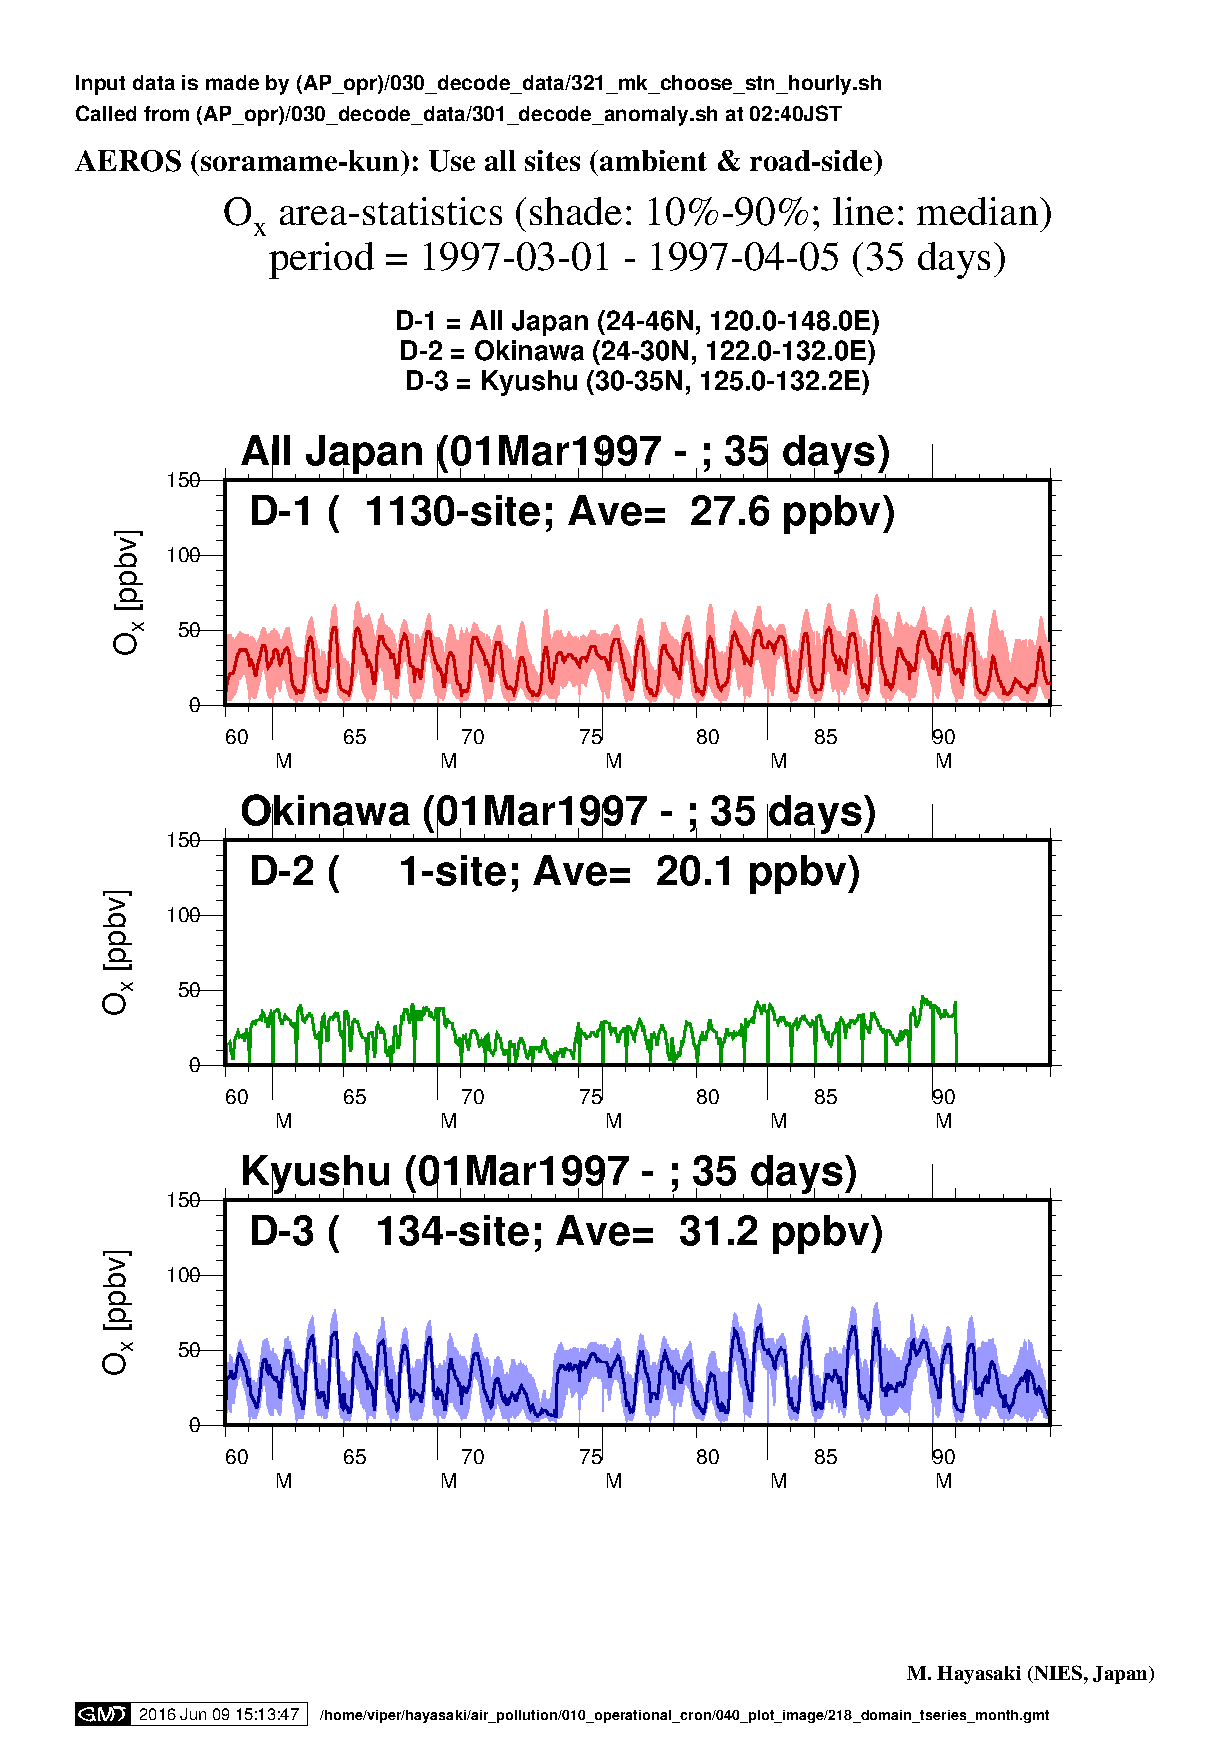
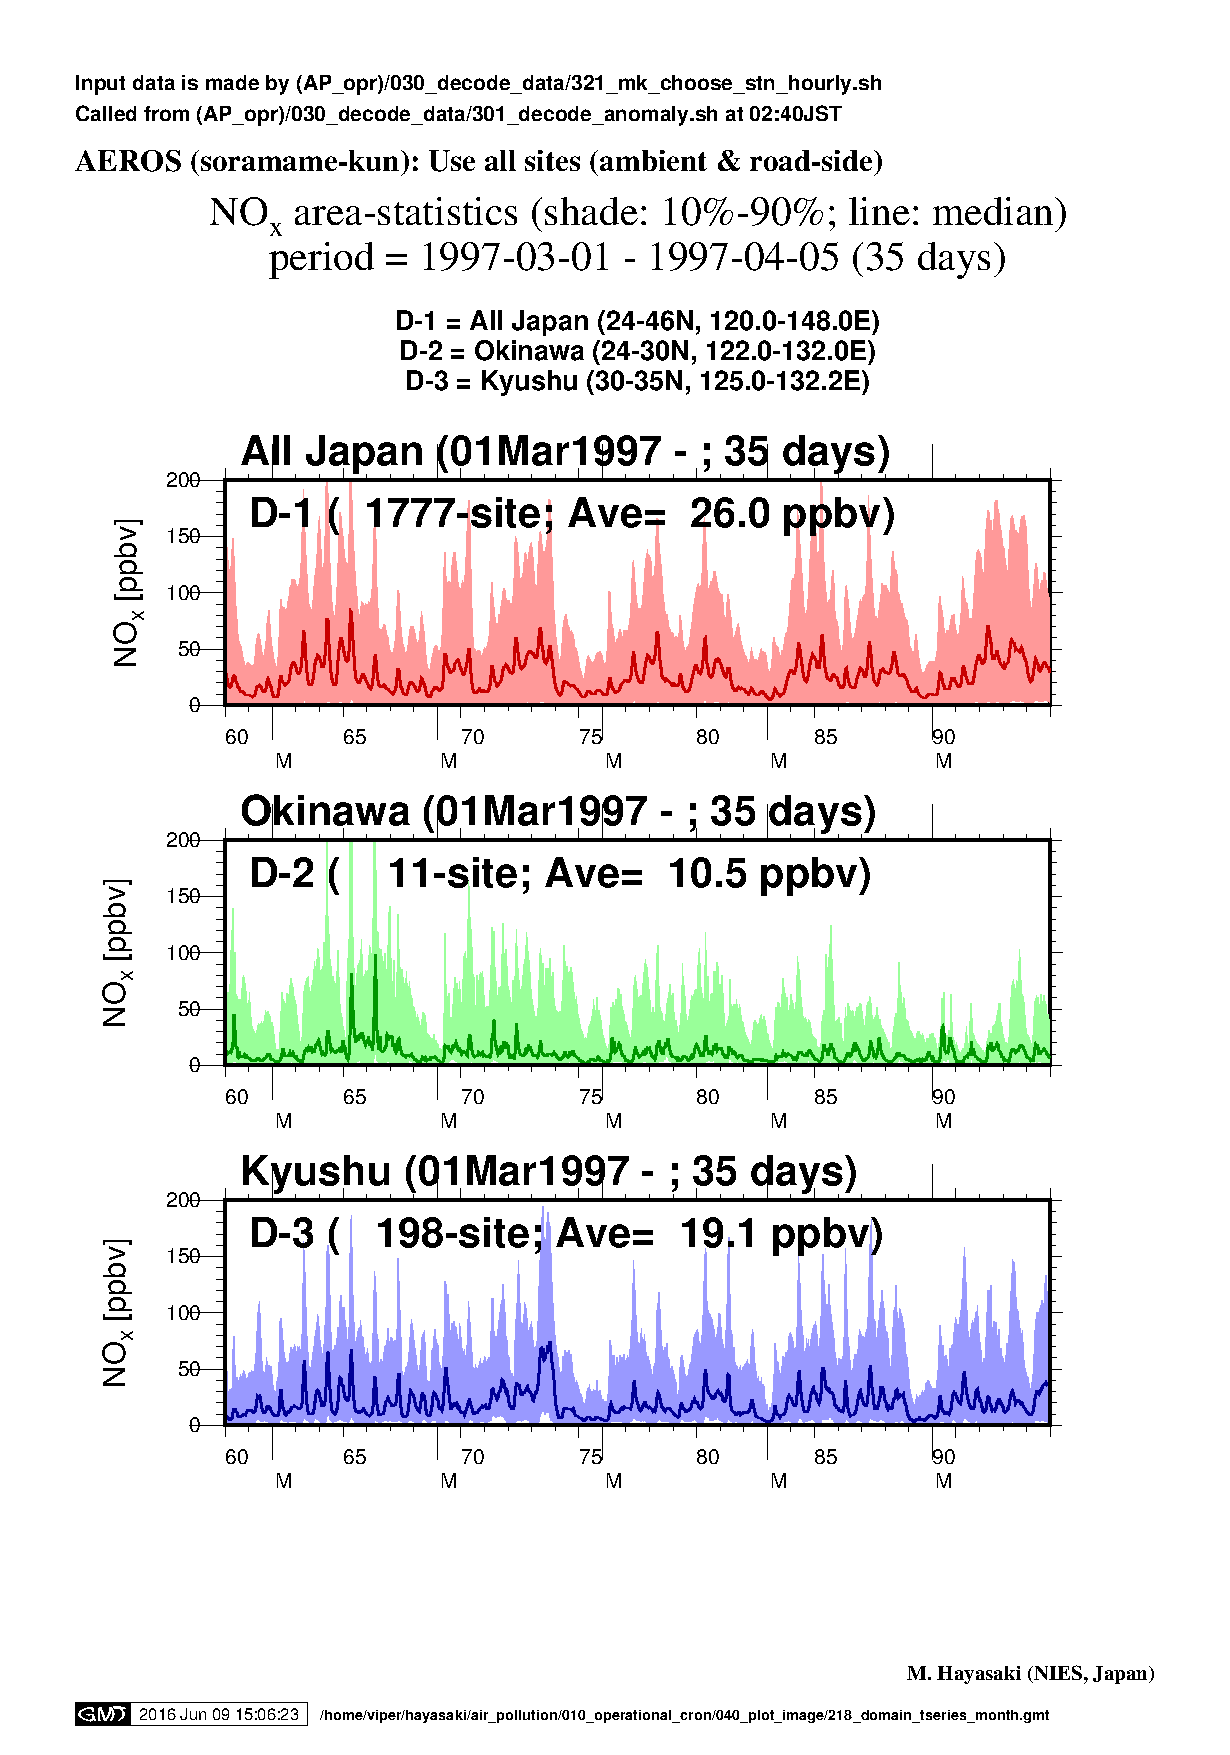
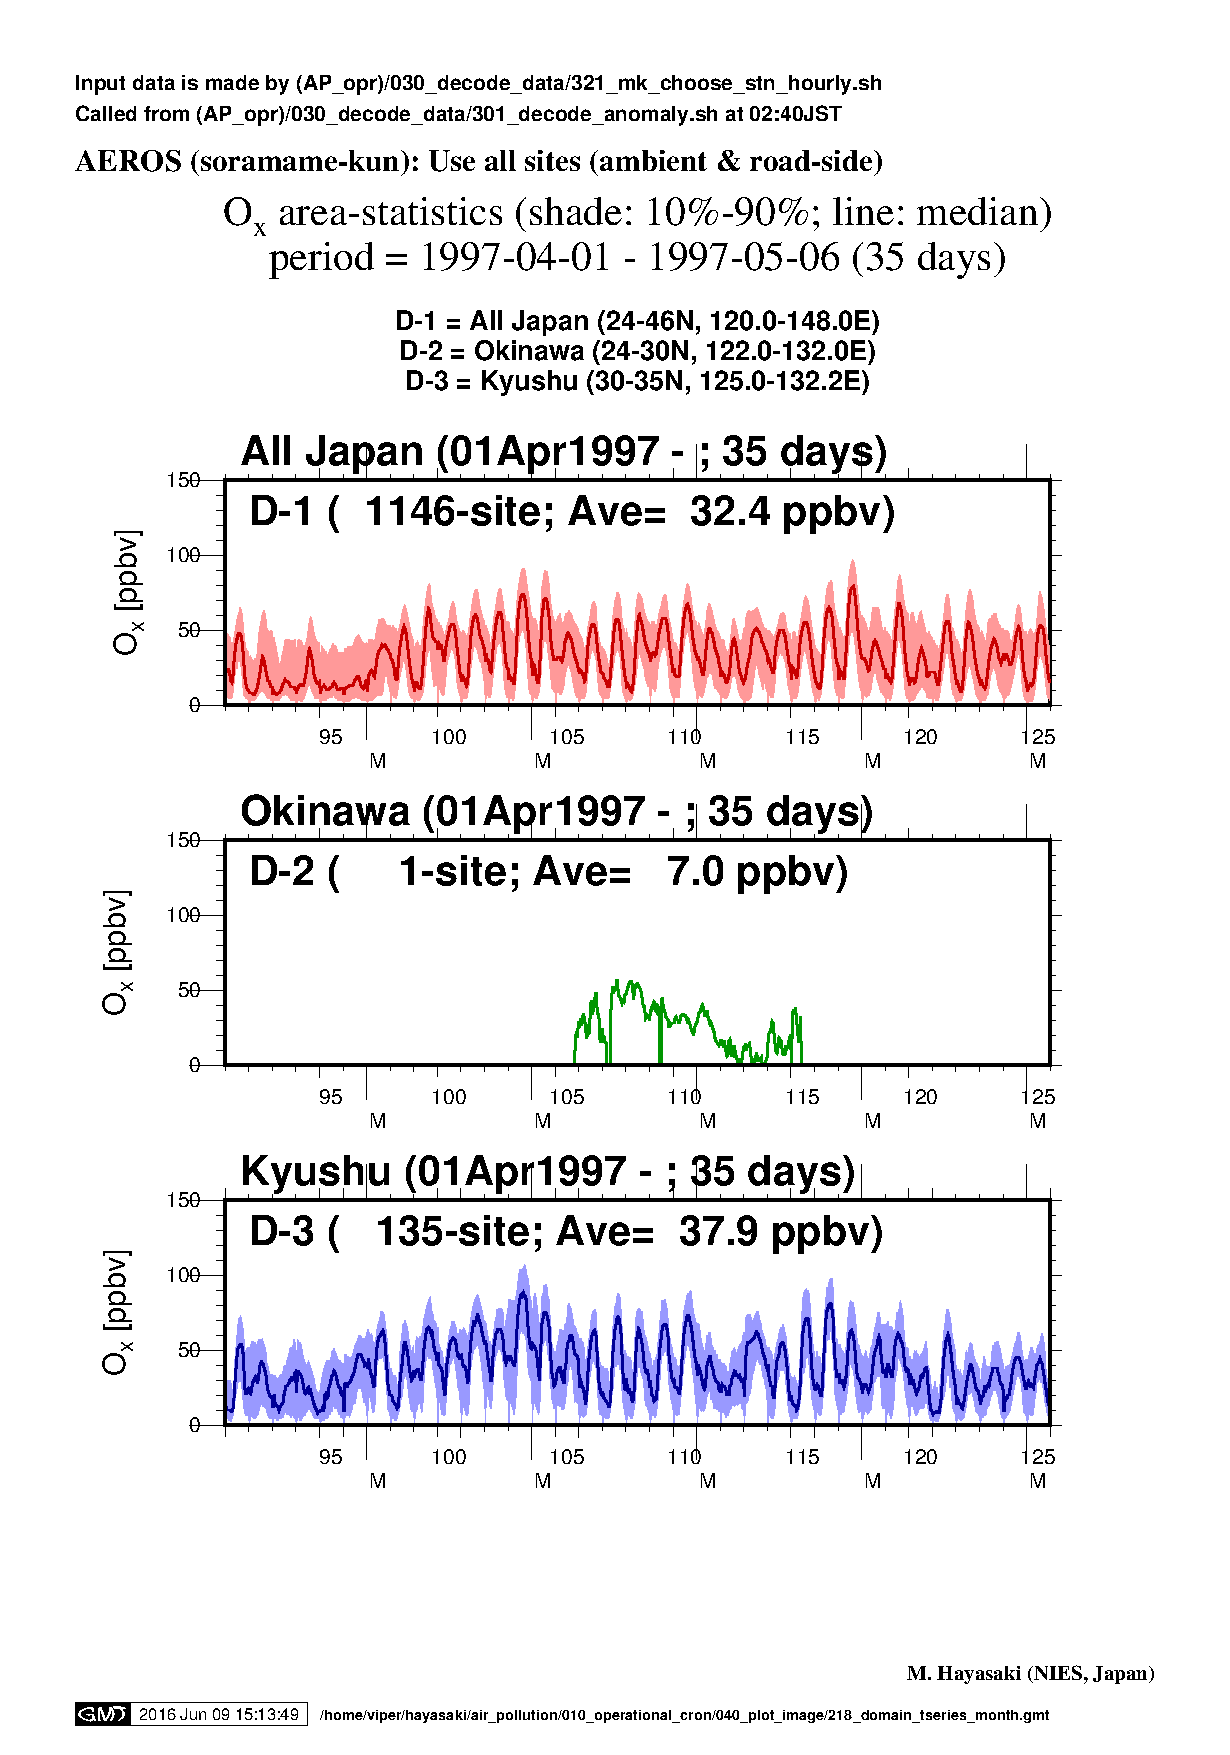
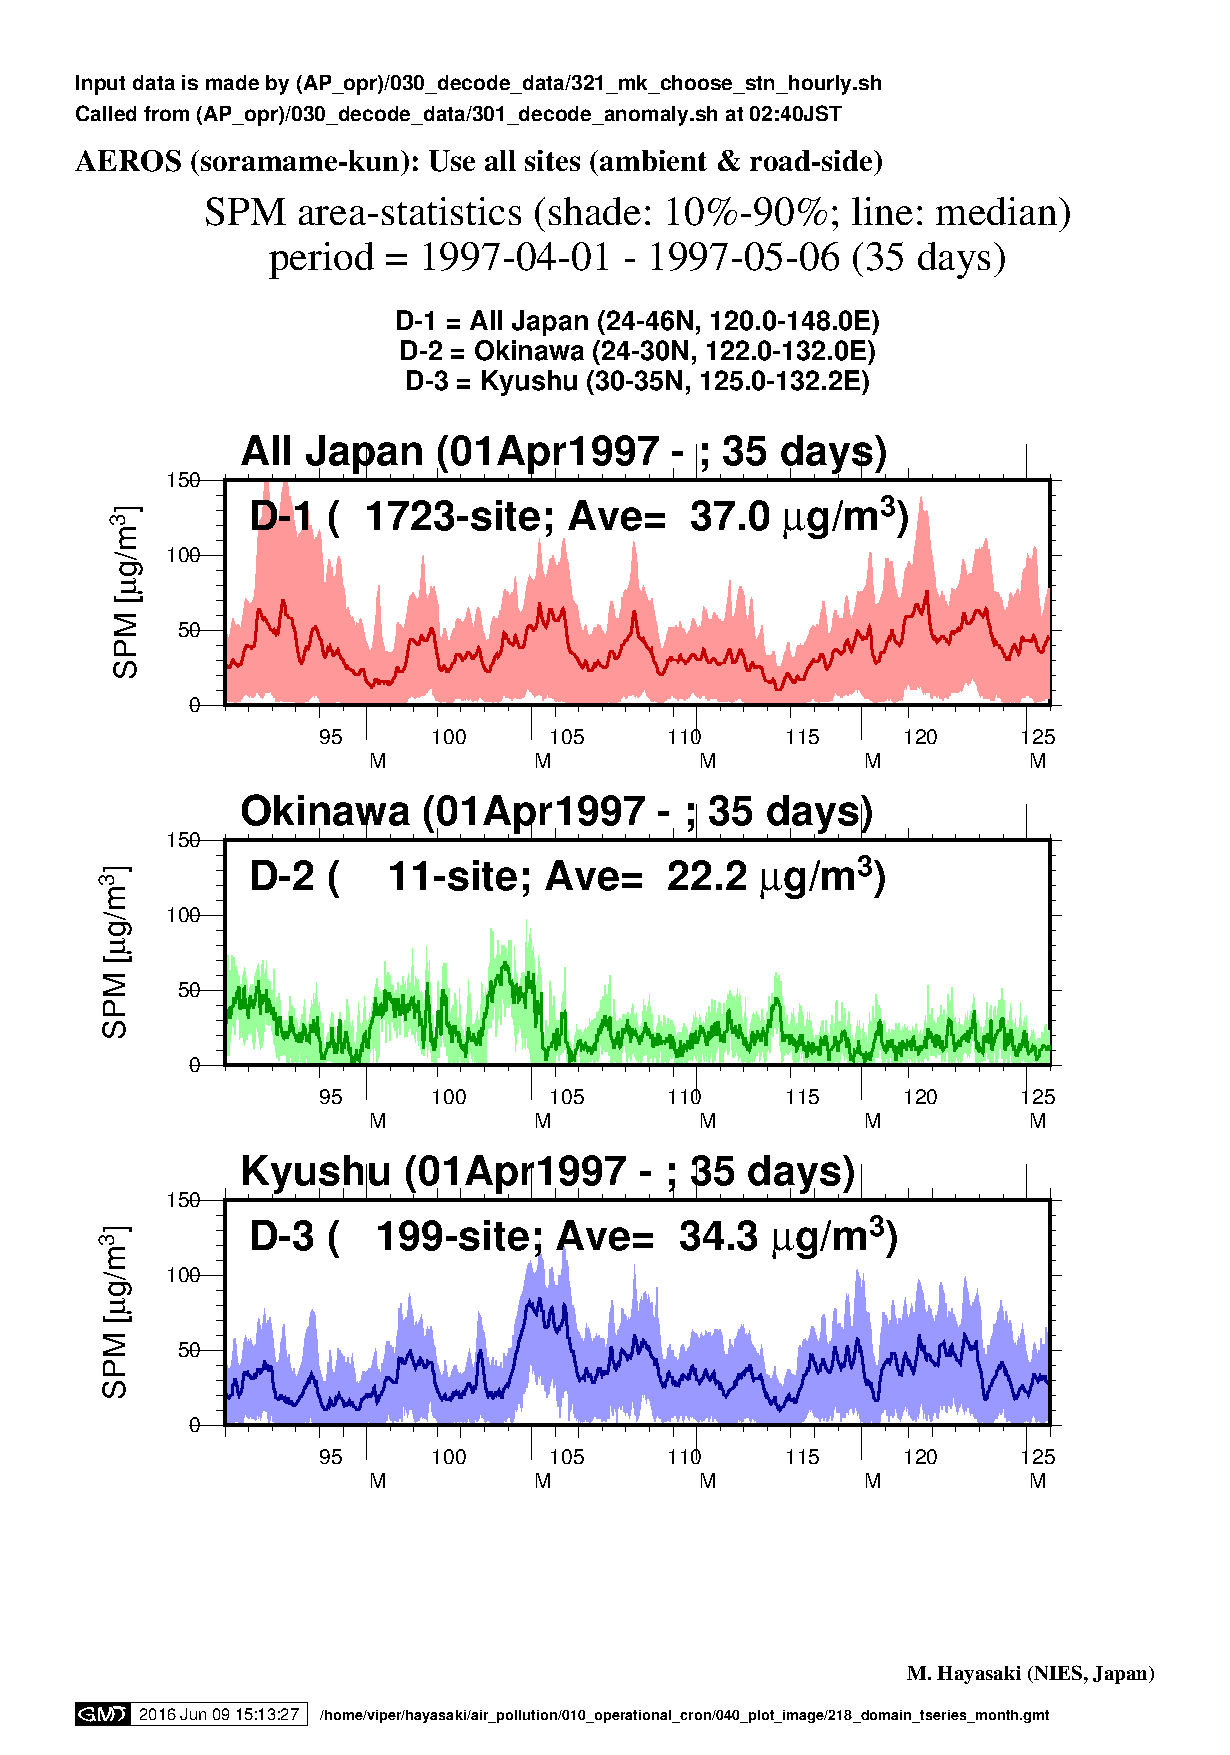
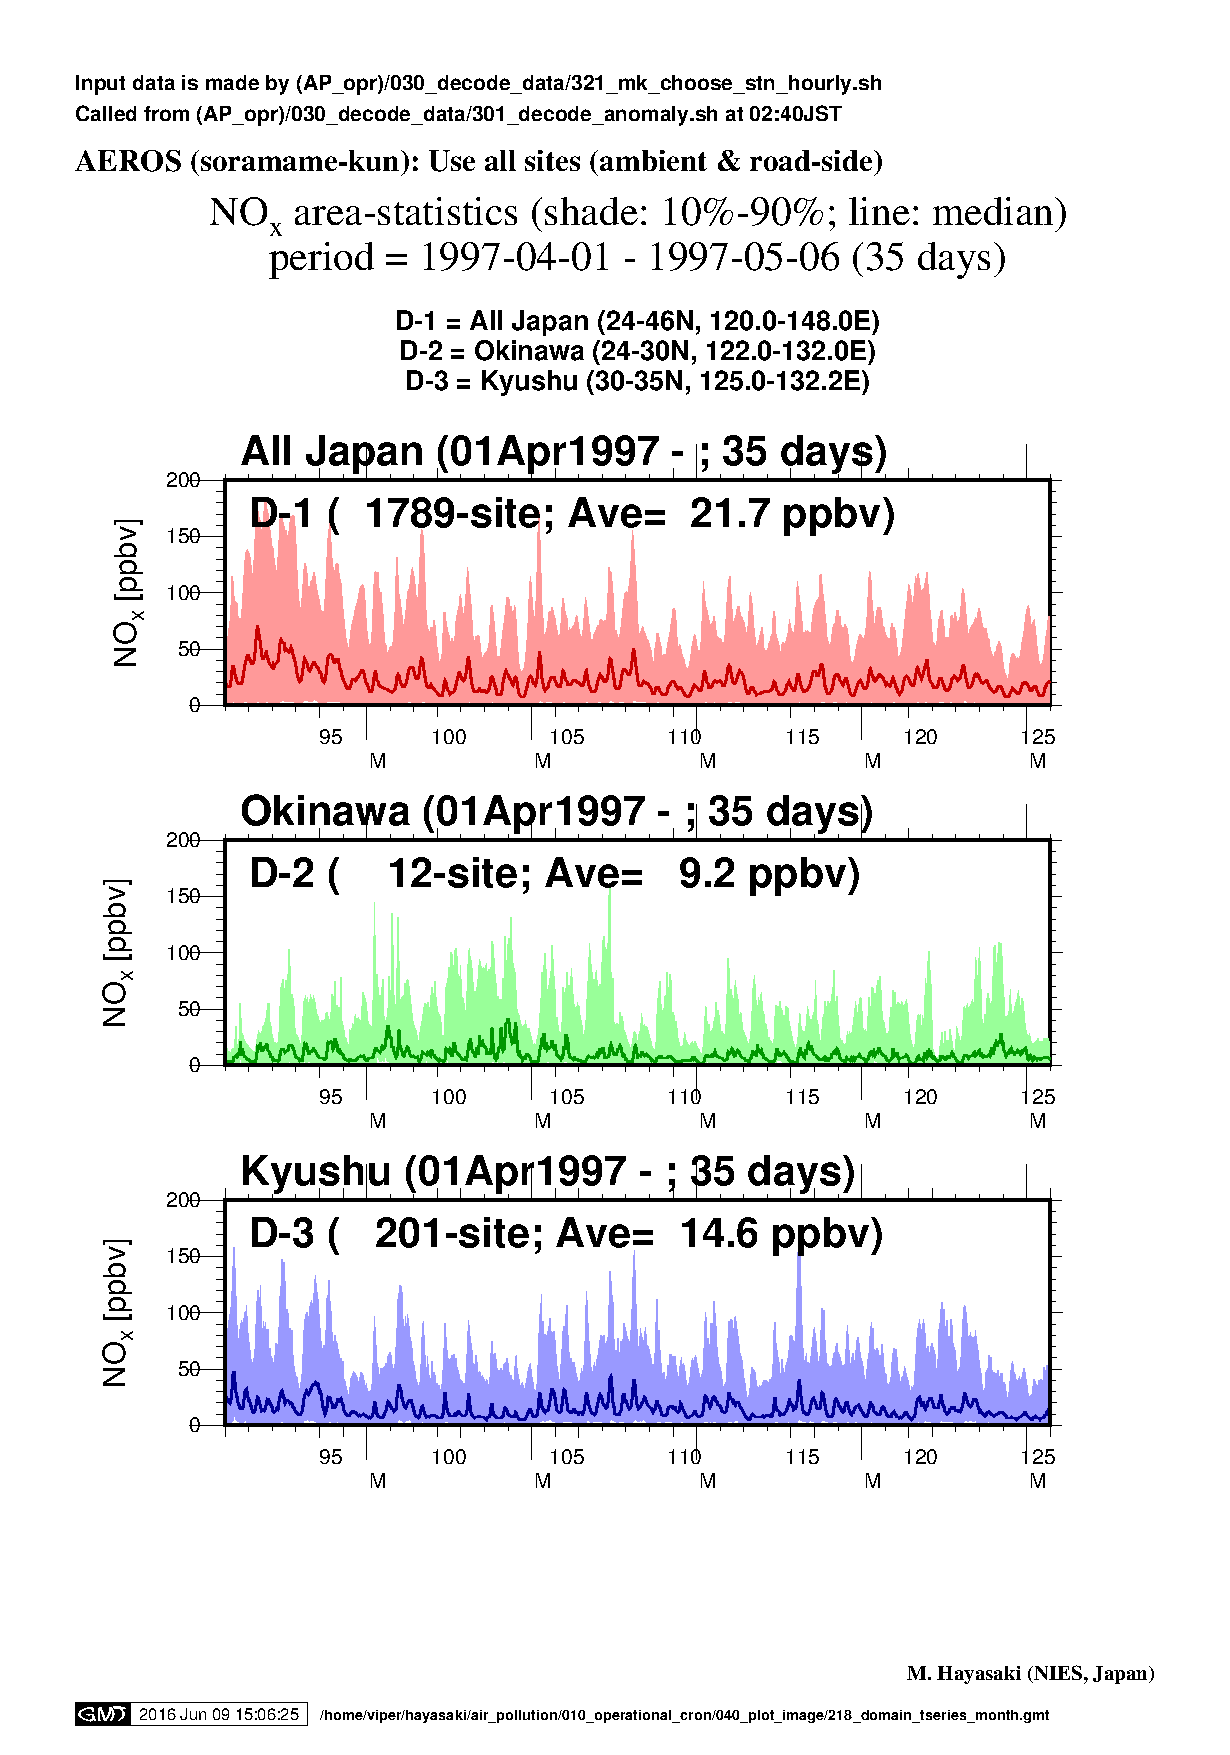
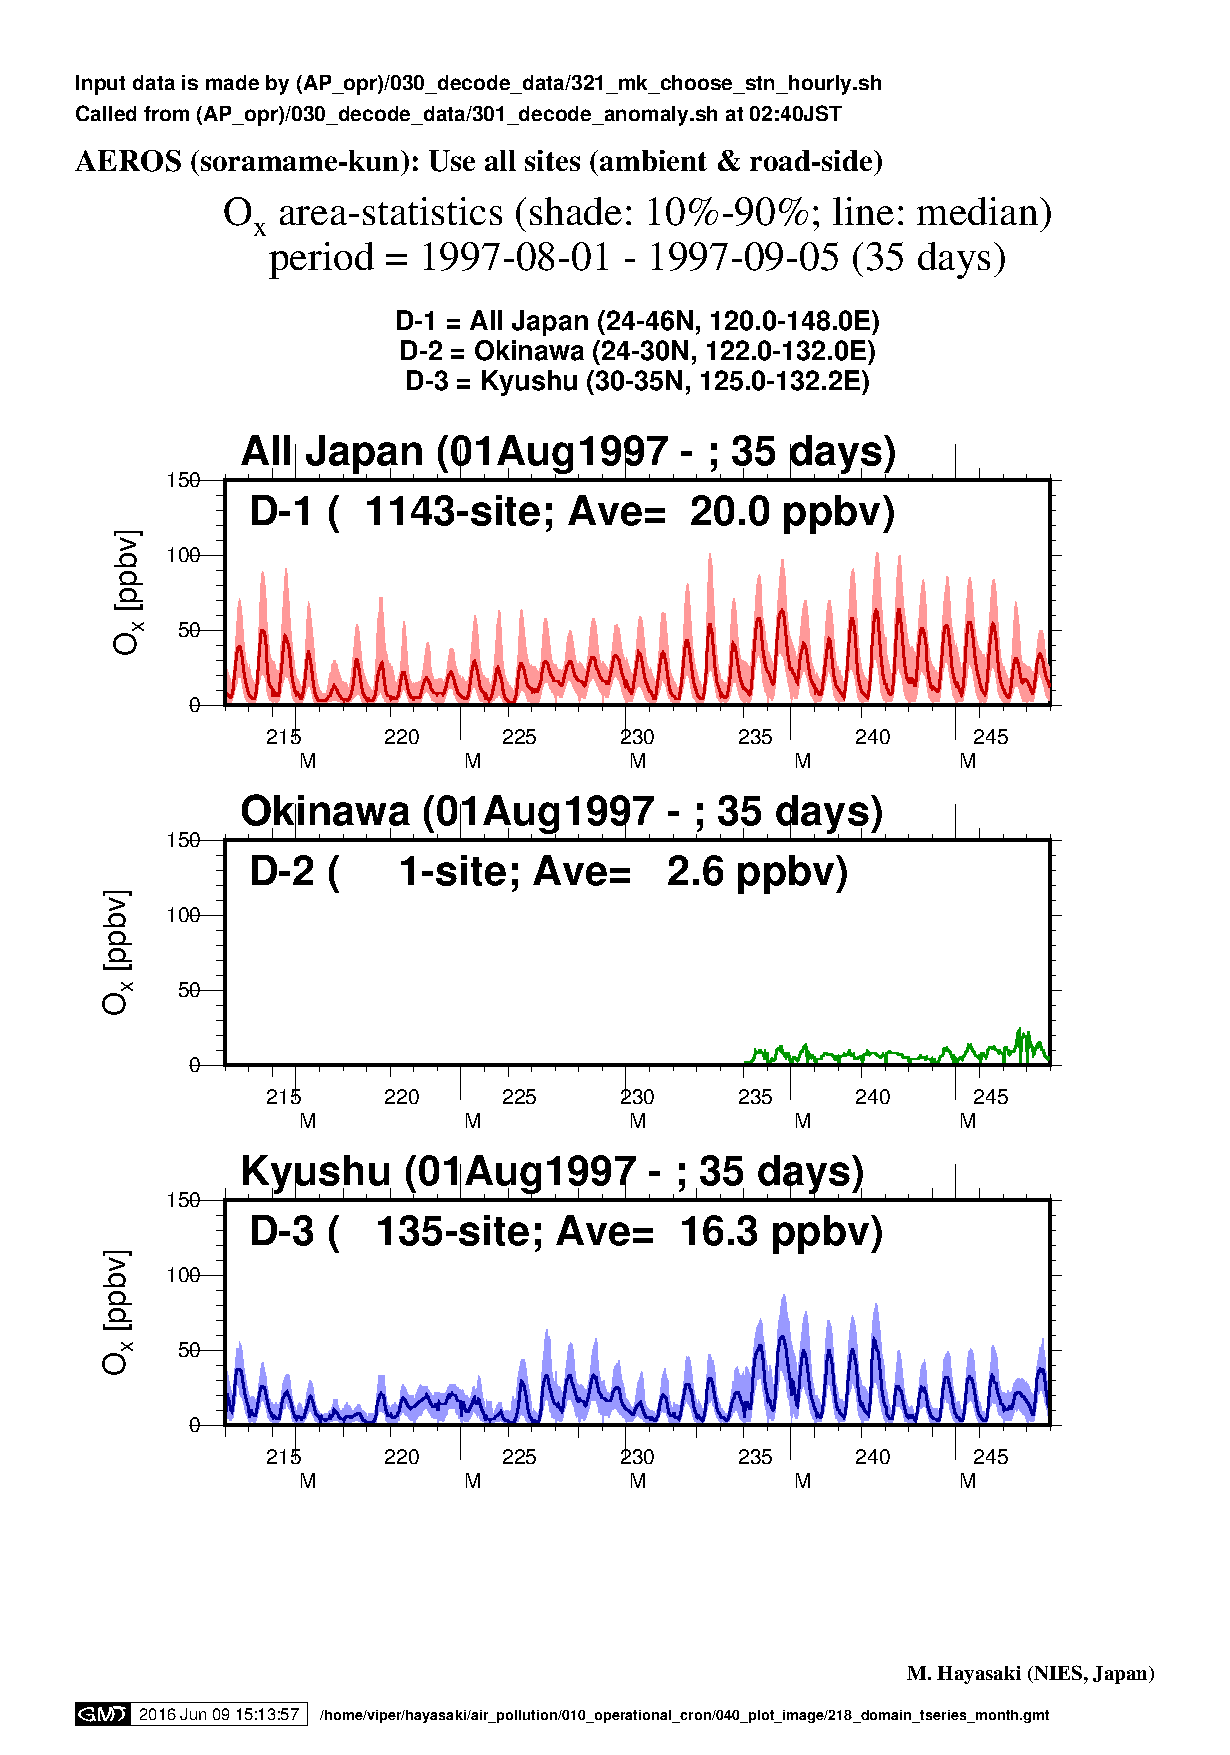
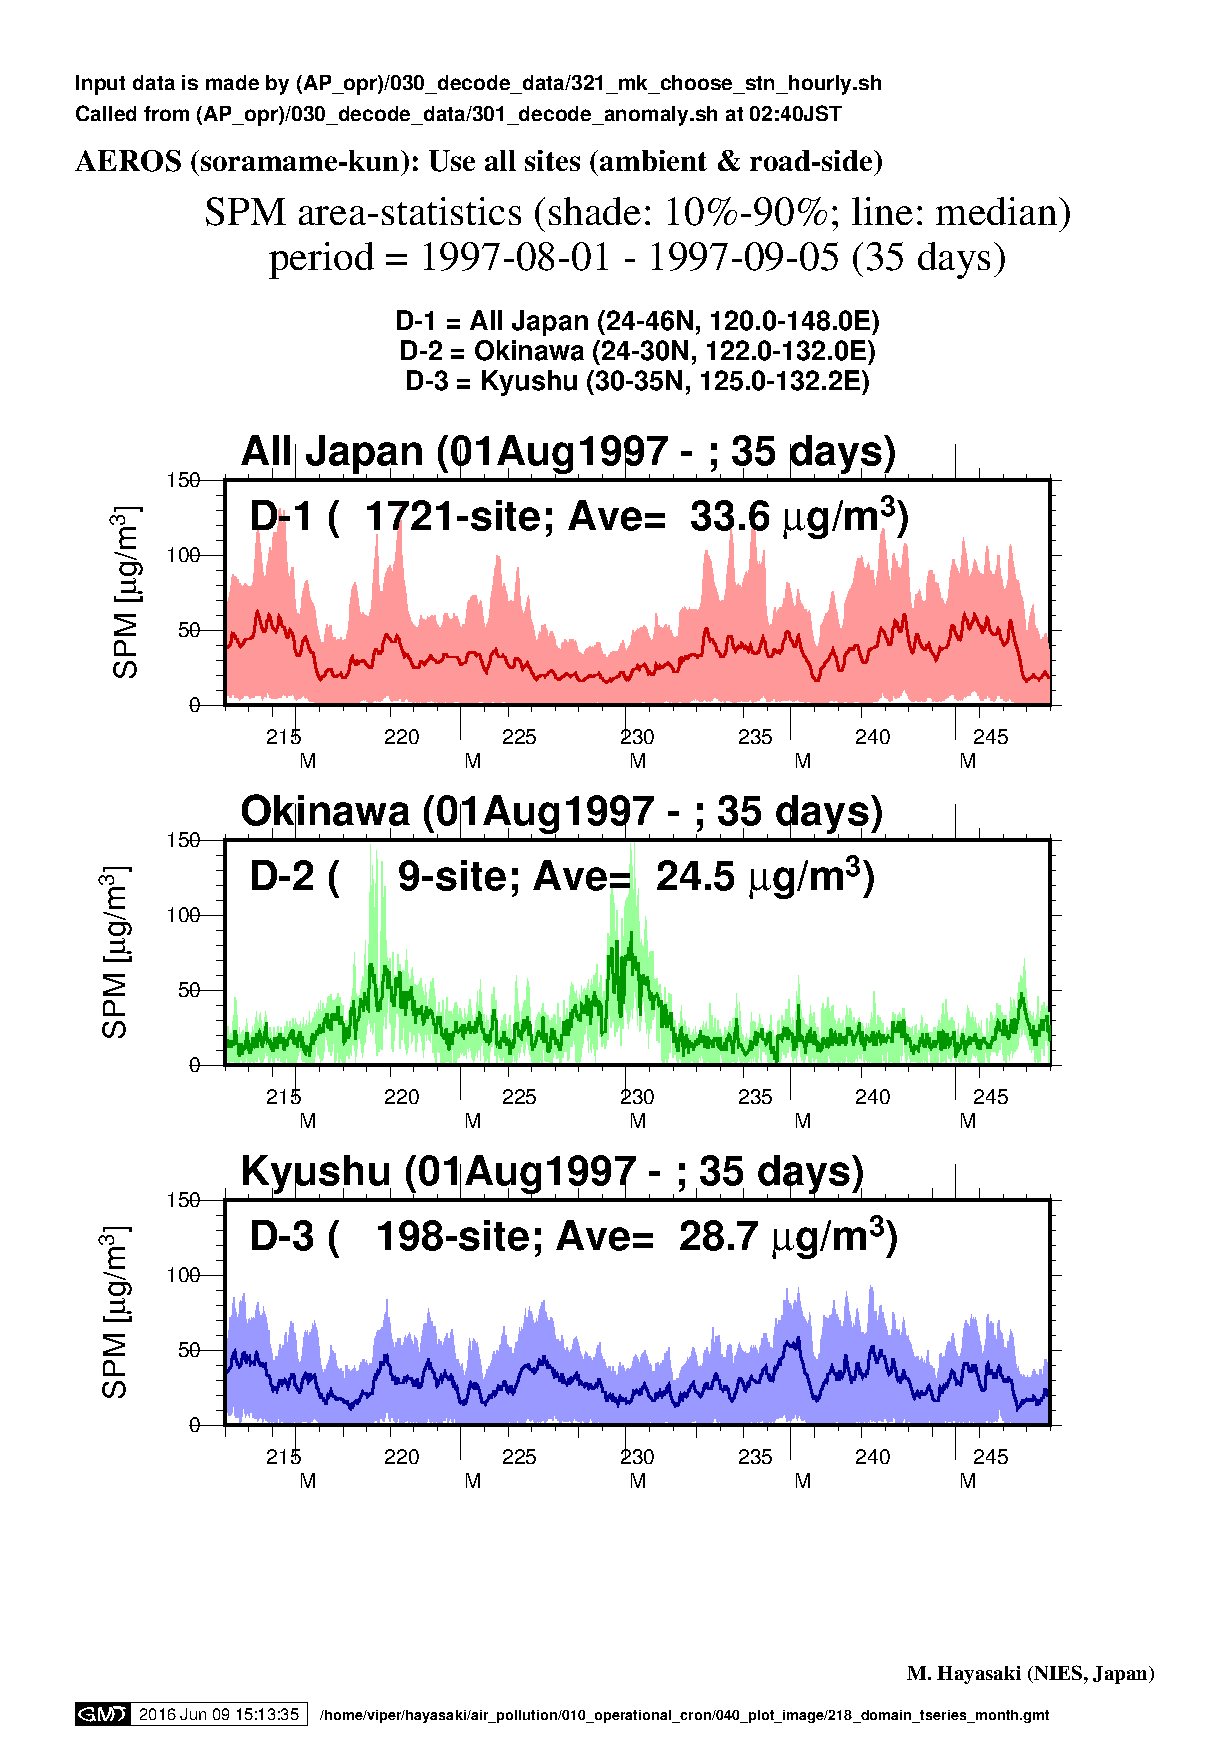
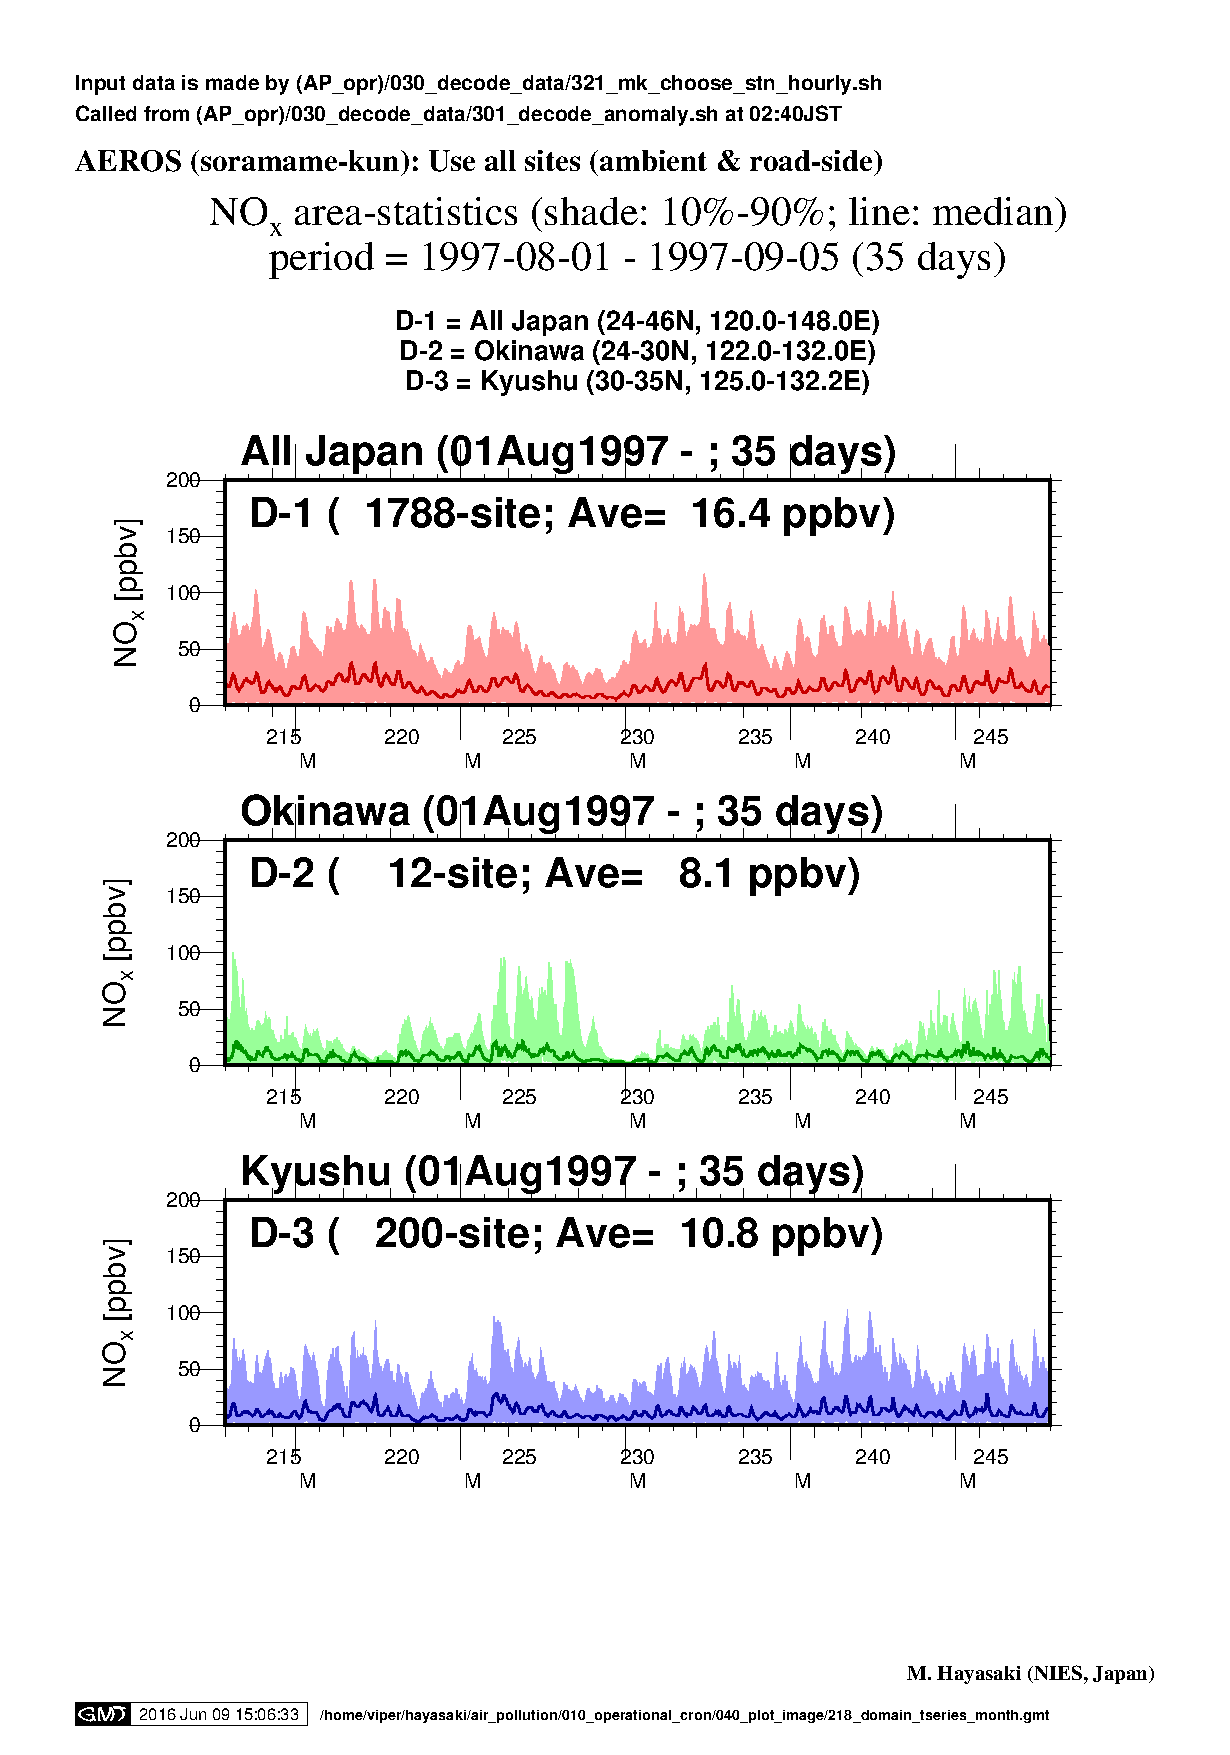
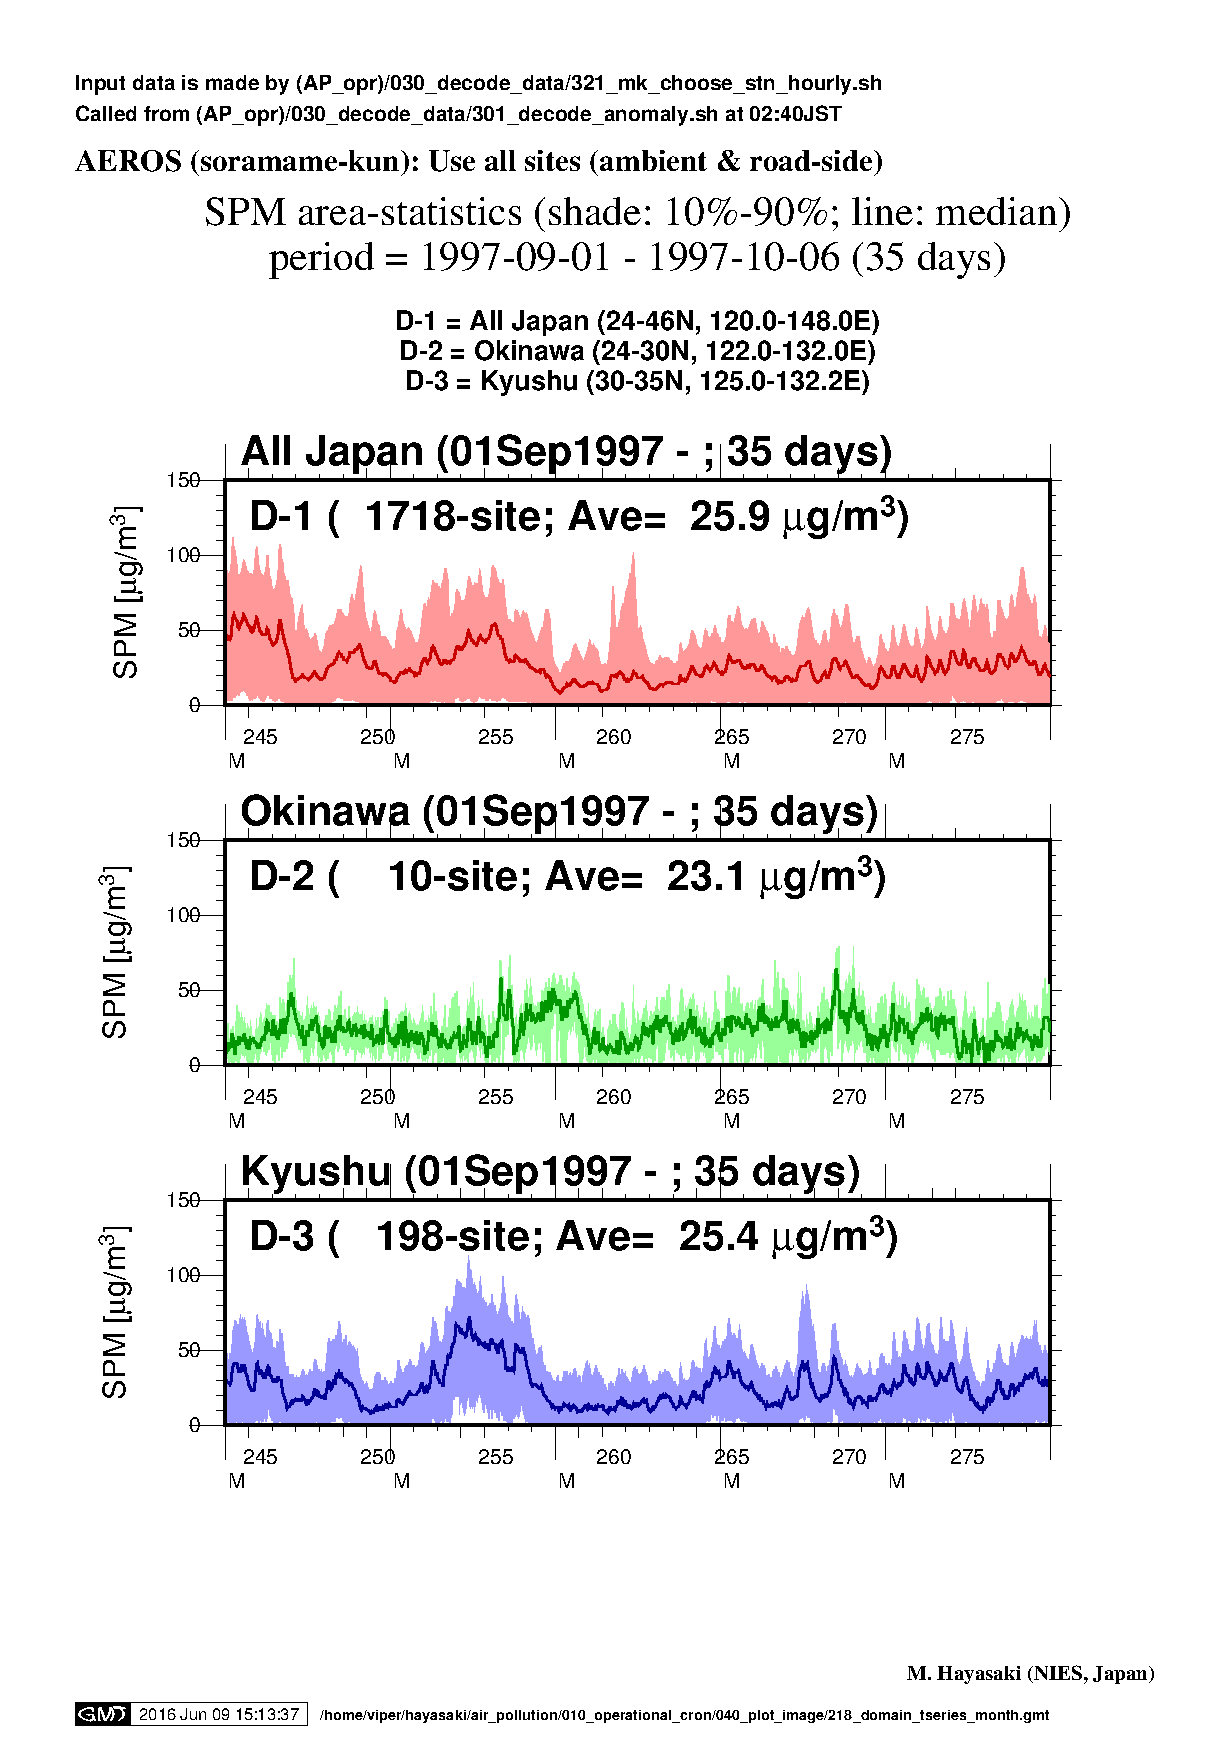
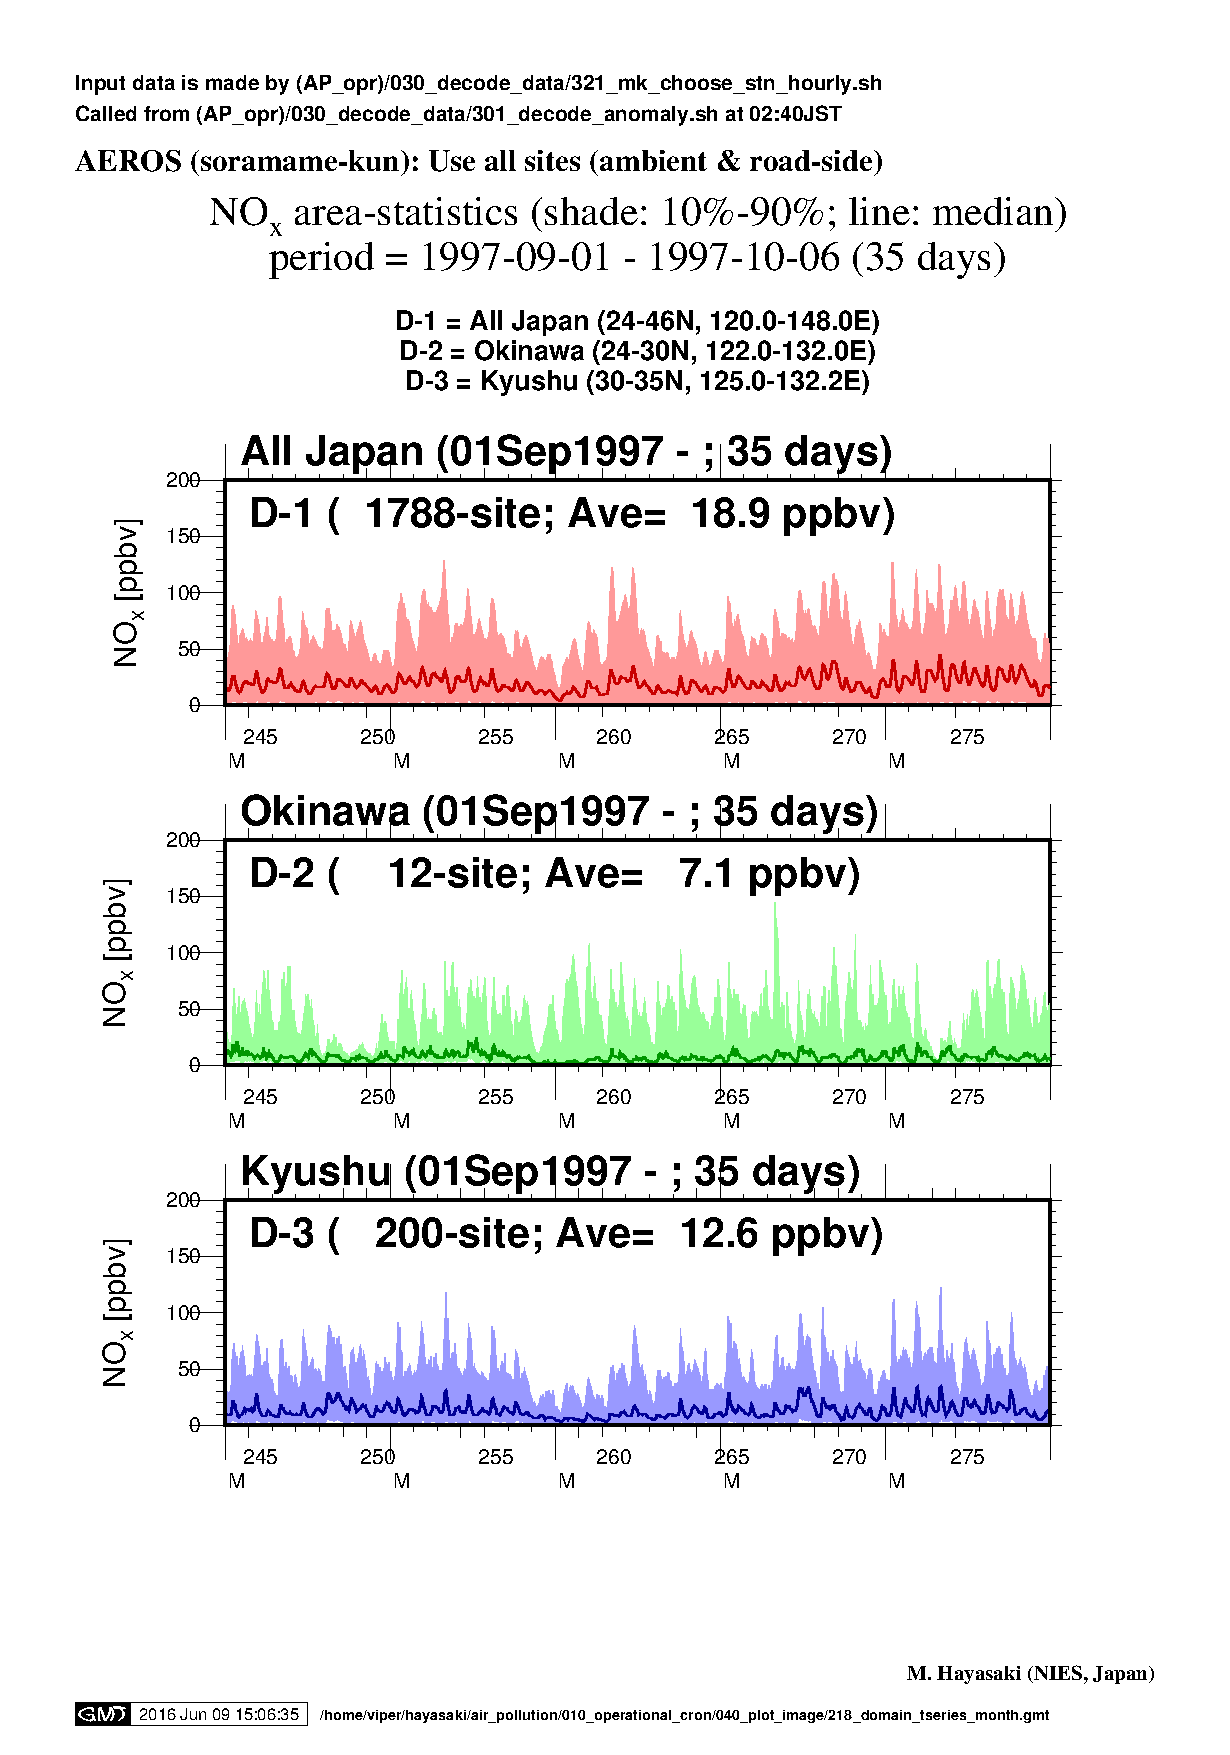
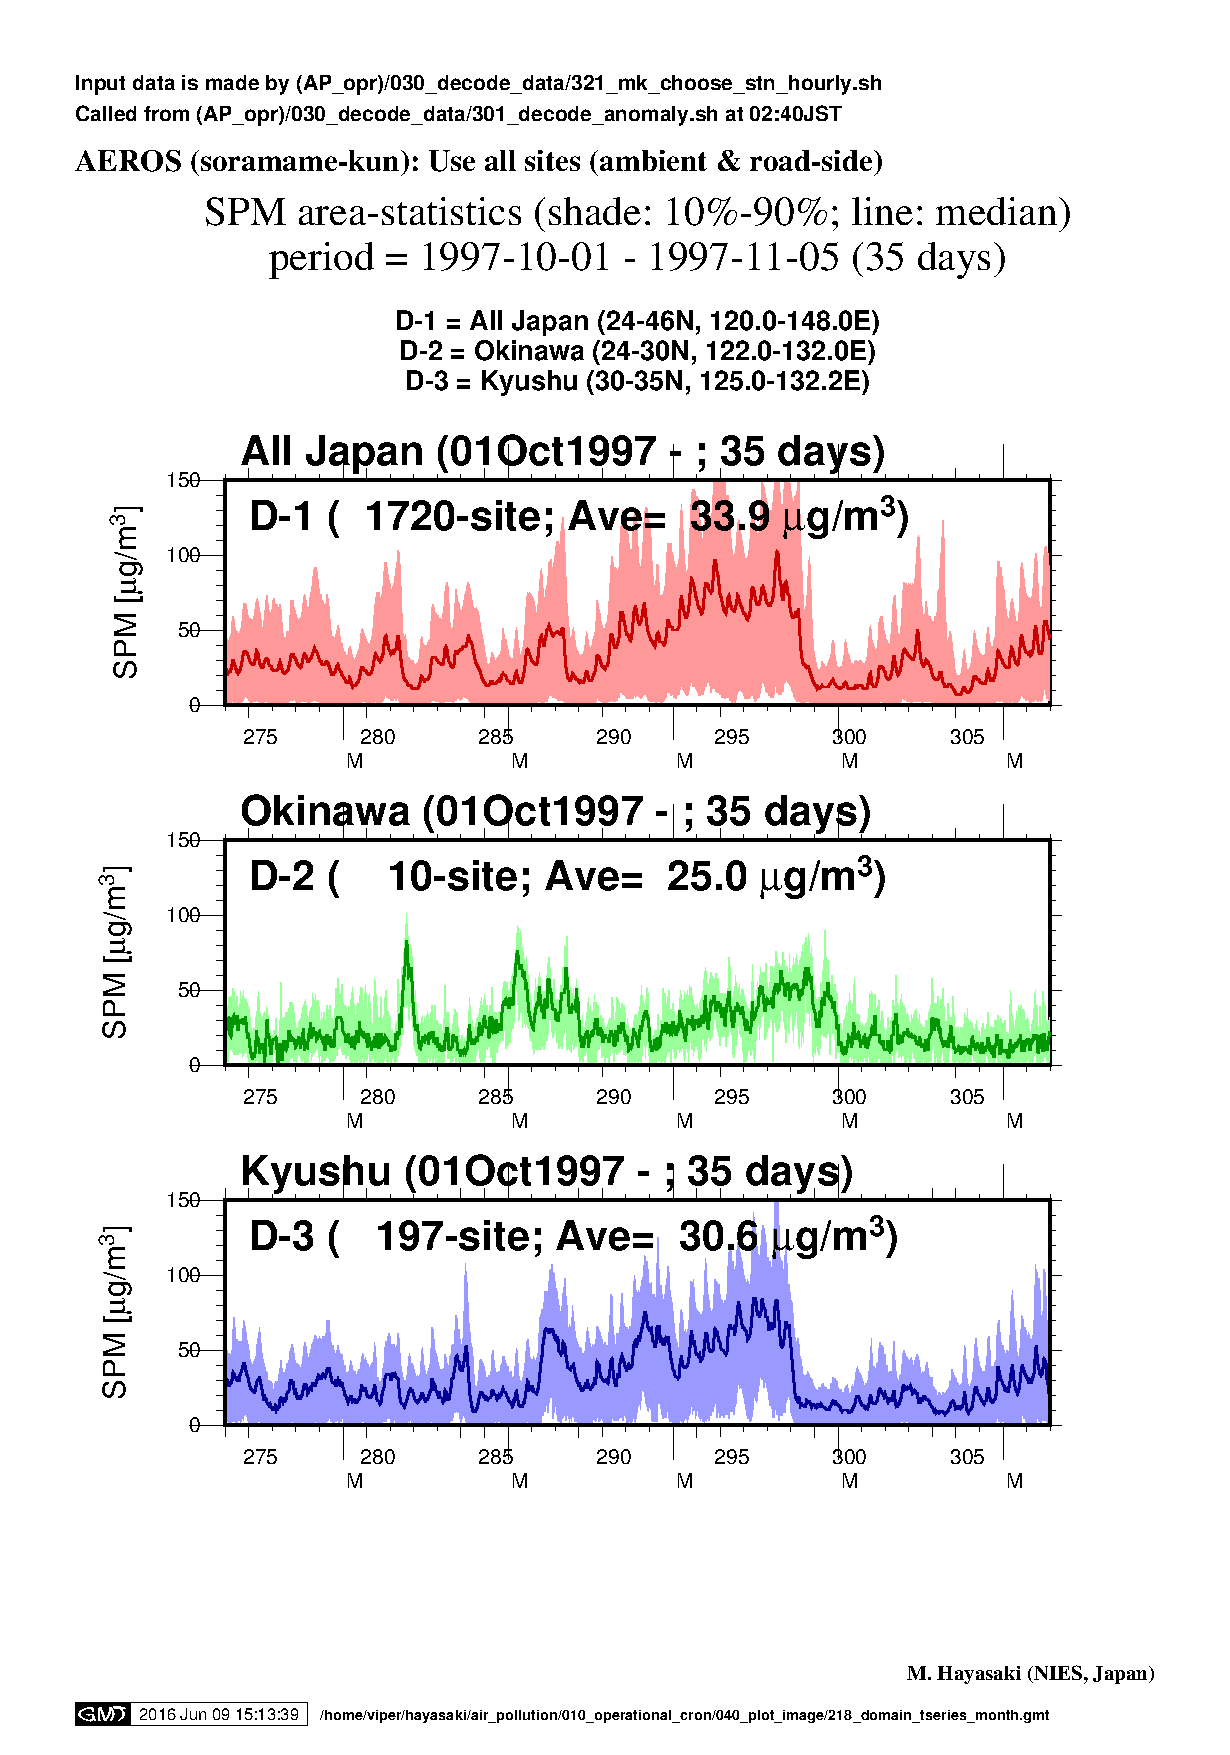
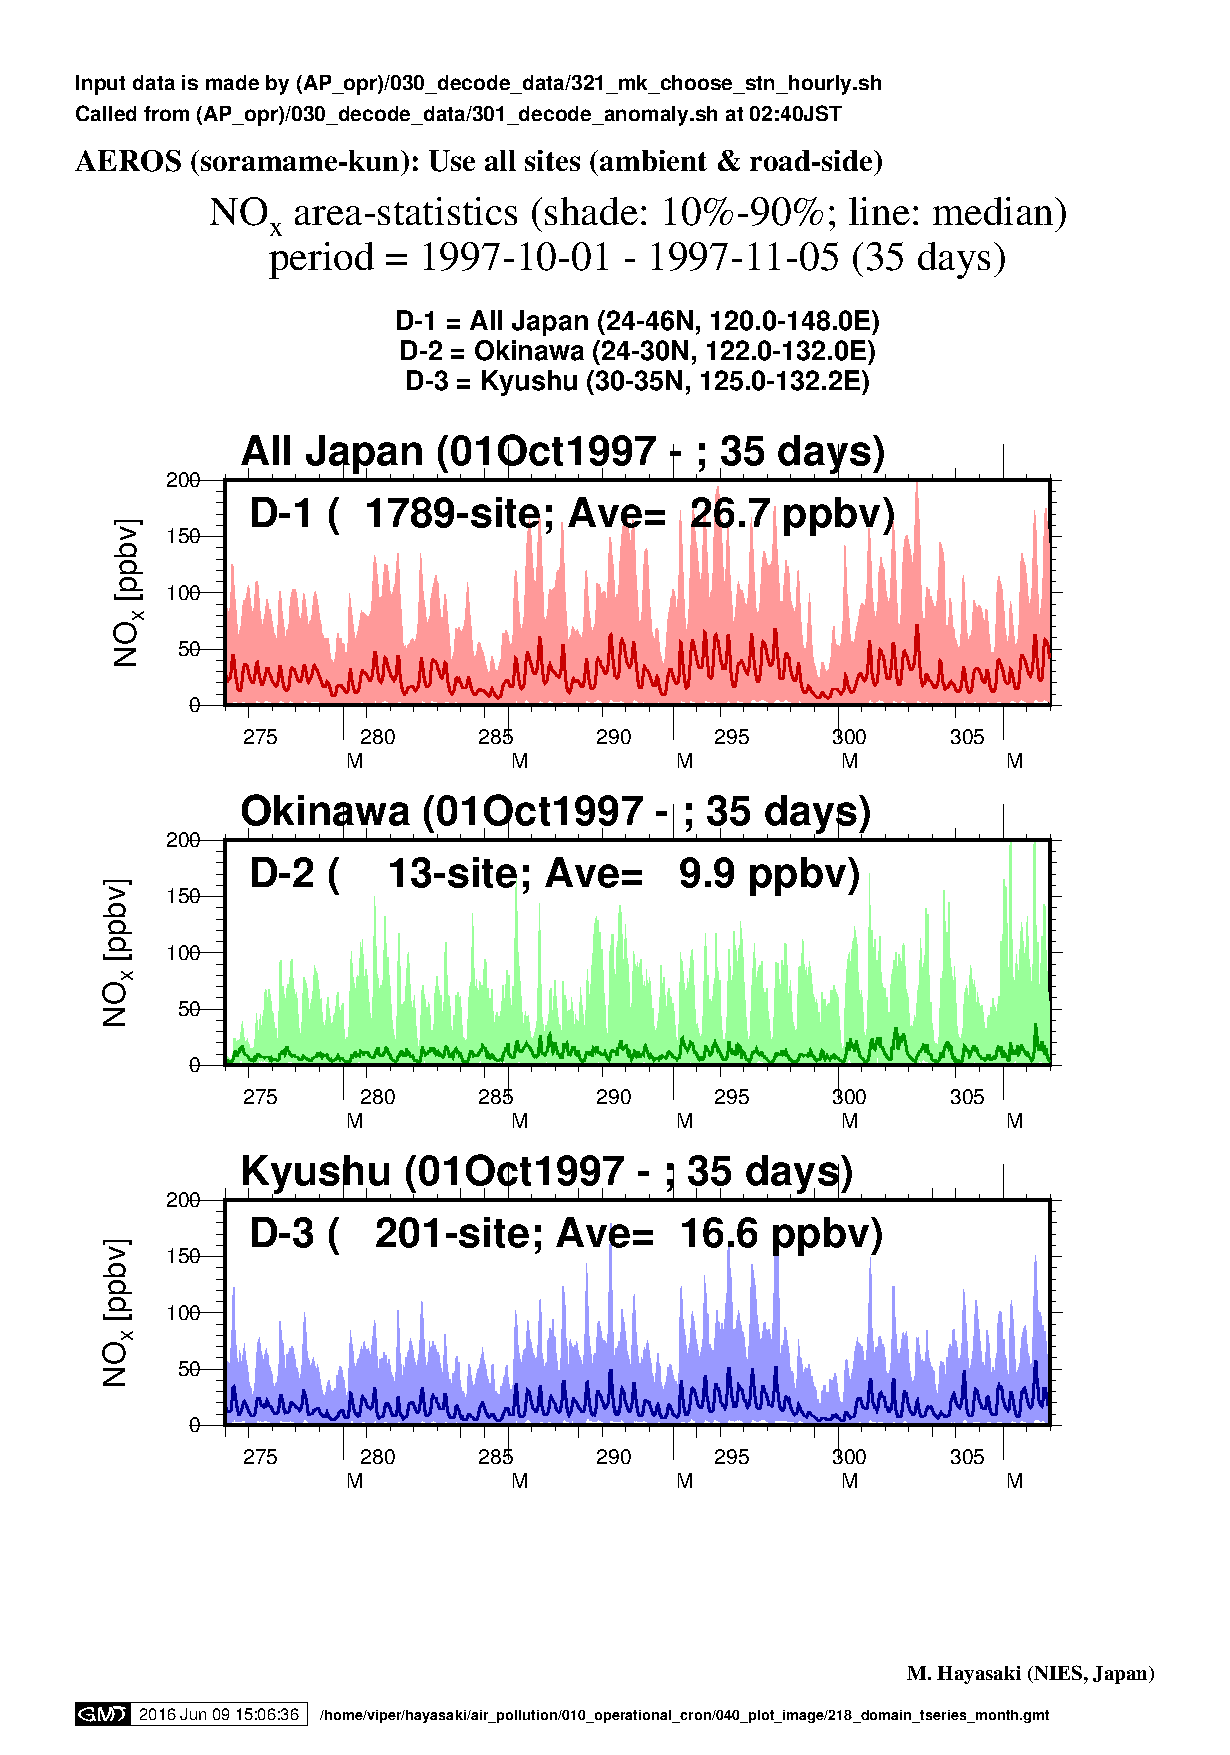
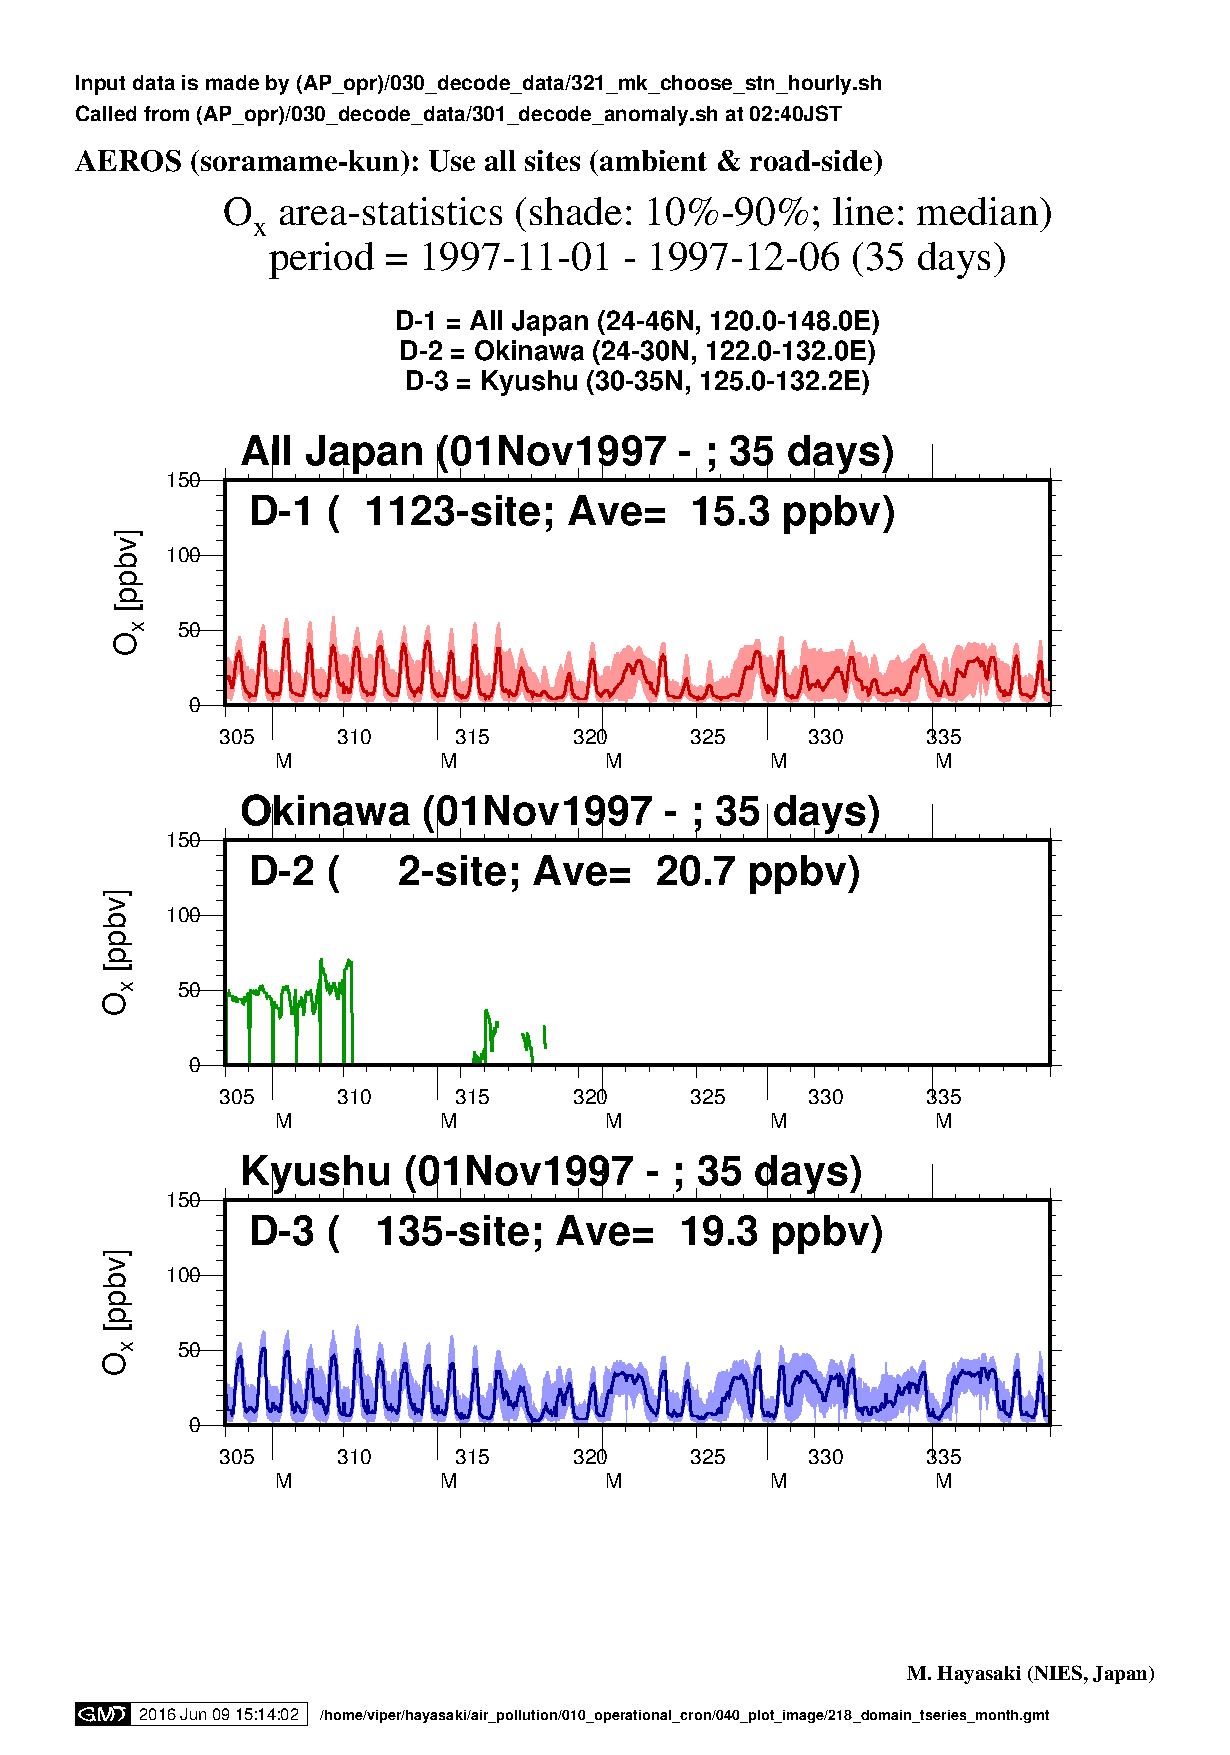
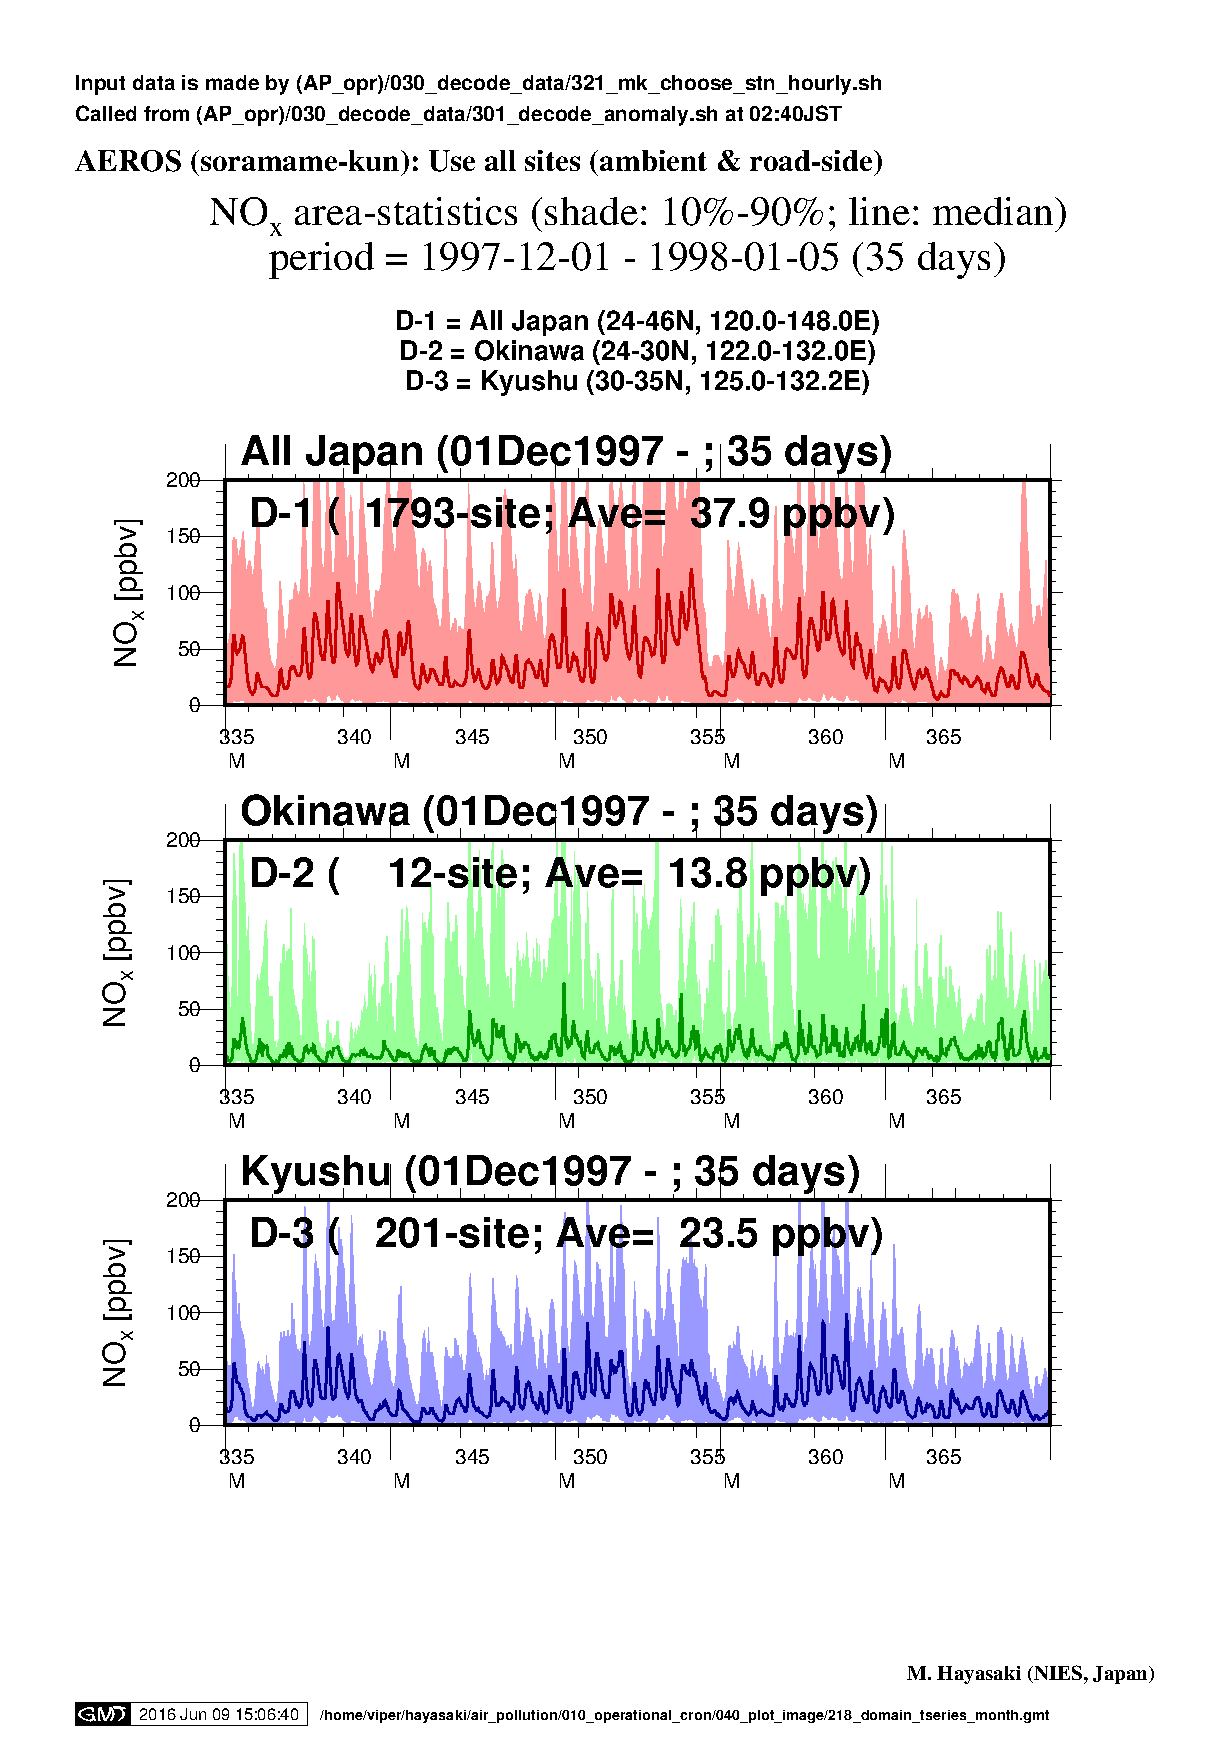
y1997: 全国,沖縄,九州 (領域 1 - 3)
Jan, Feb, Mar, Apr, May, Jun, Jul, Aug, Sep, Oct, Nov, Dec,
| Month | Ox | SPM | PM2.5 | NOx |
|---|---|---|---|---|
| Jan1997 (D1 - 3) |

|
|
NA |
|
| Feb1997 (D1 - 3) |

|

|
NA |
|
| Mar1997 (D1 - 3) |
|

|
NA |
|
| Month | Ox | SPM | PM2.5 | NOx |
| Apr1997 (D1 - 3) |
|
|
NA |
|
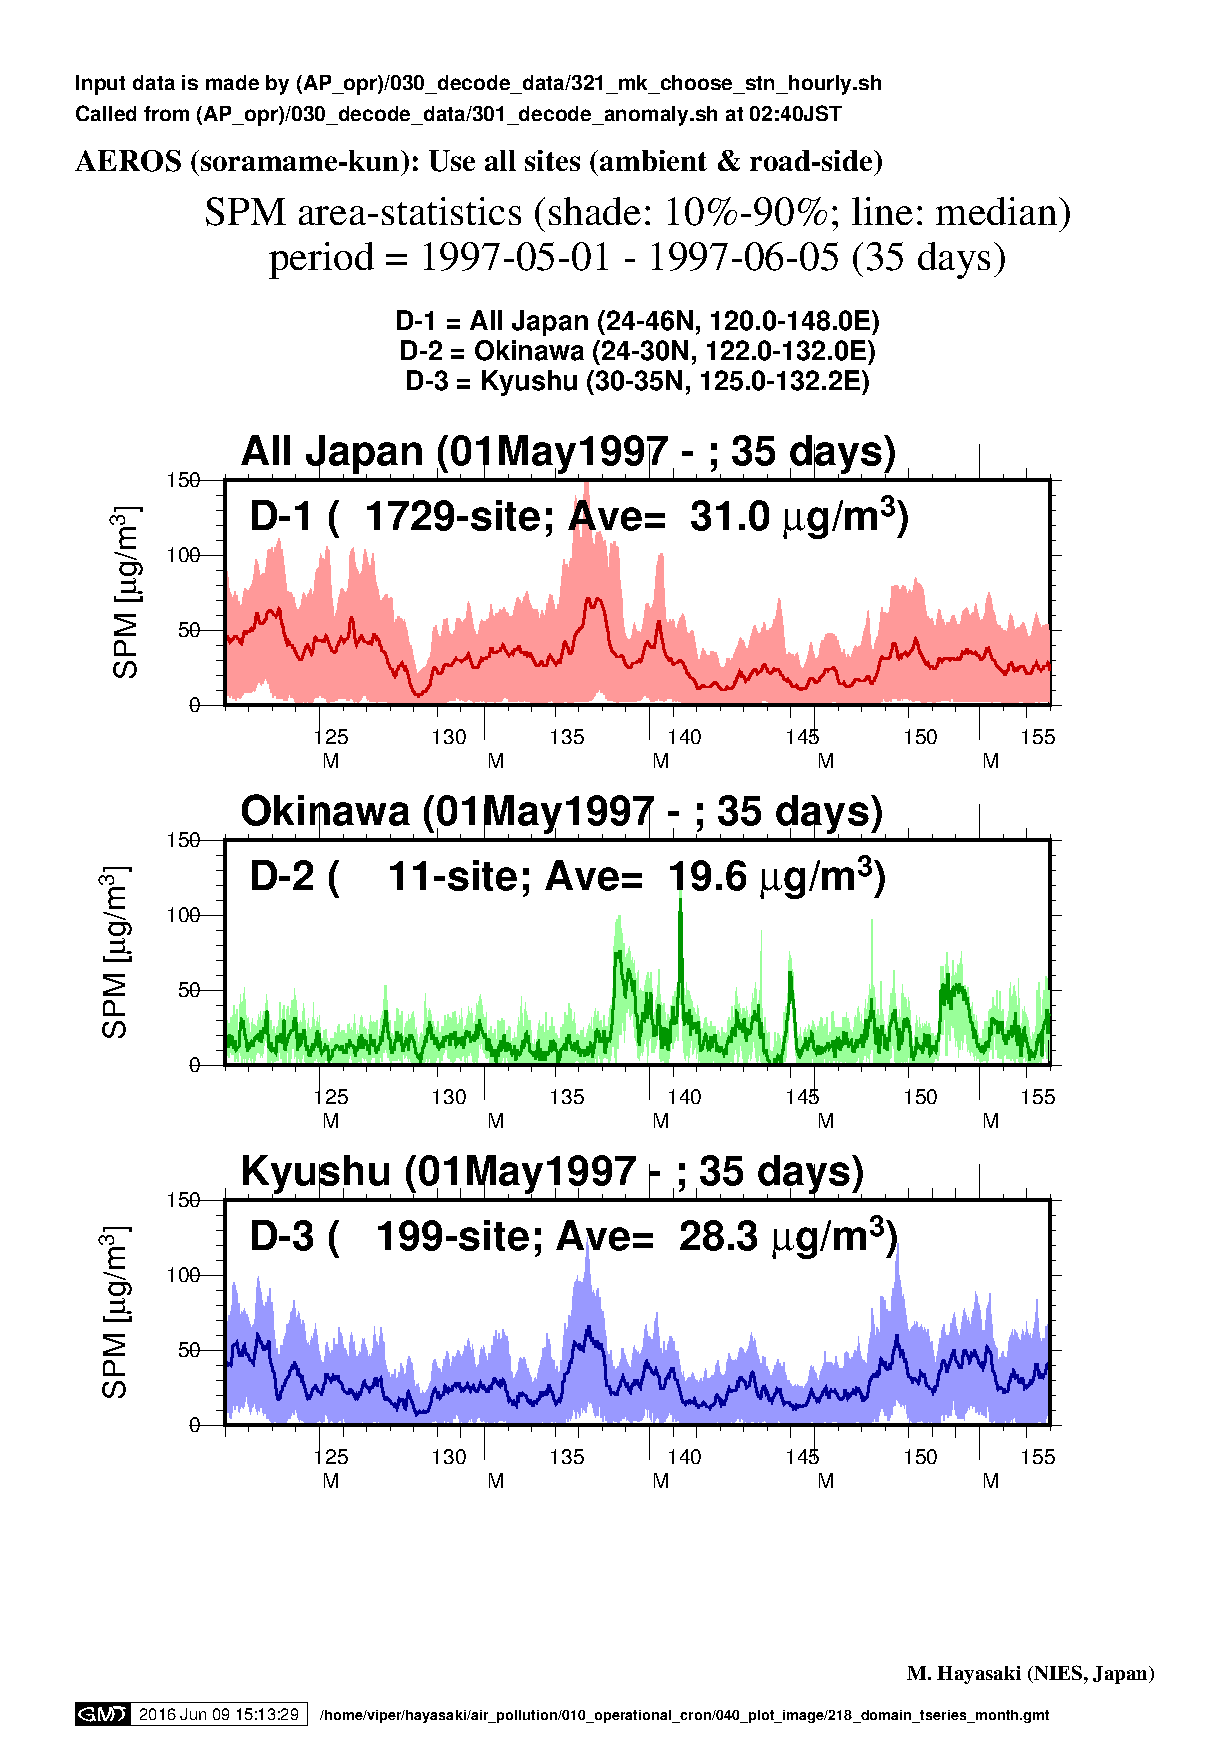
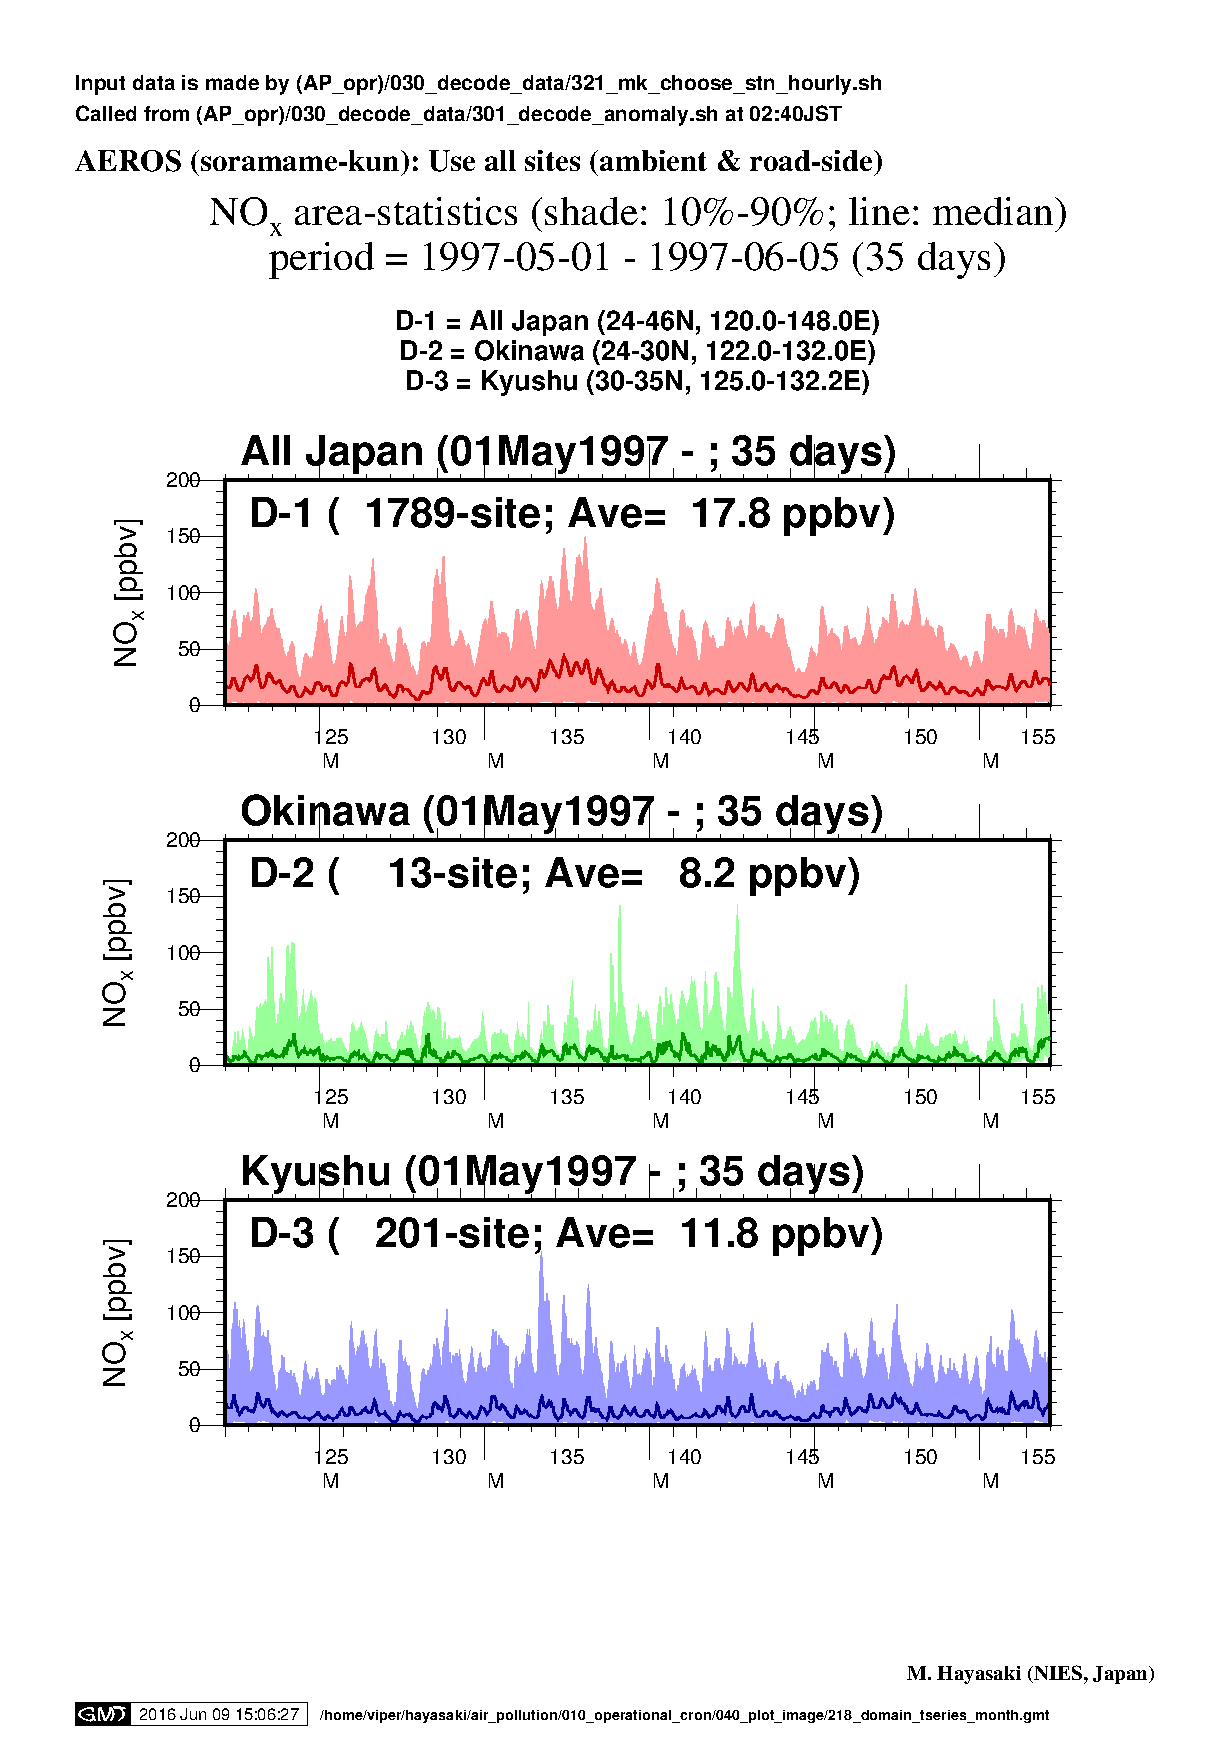
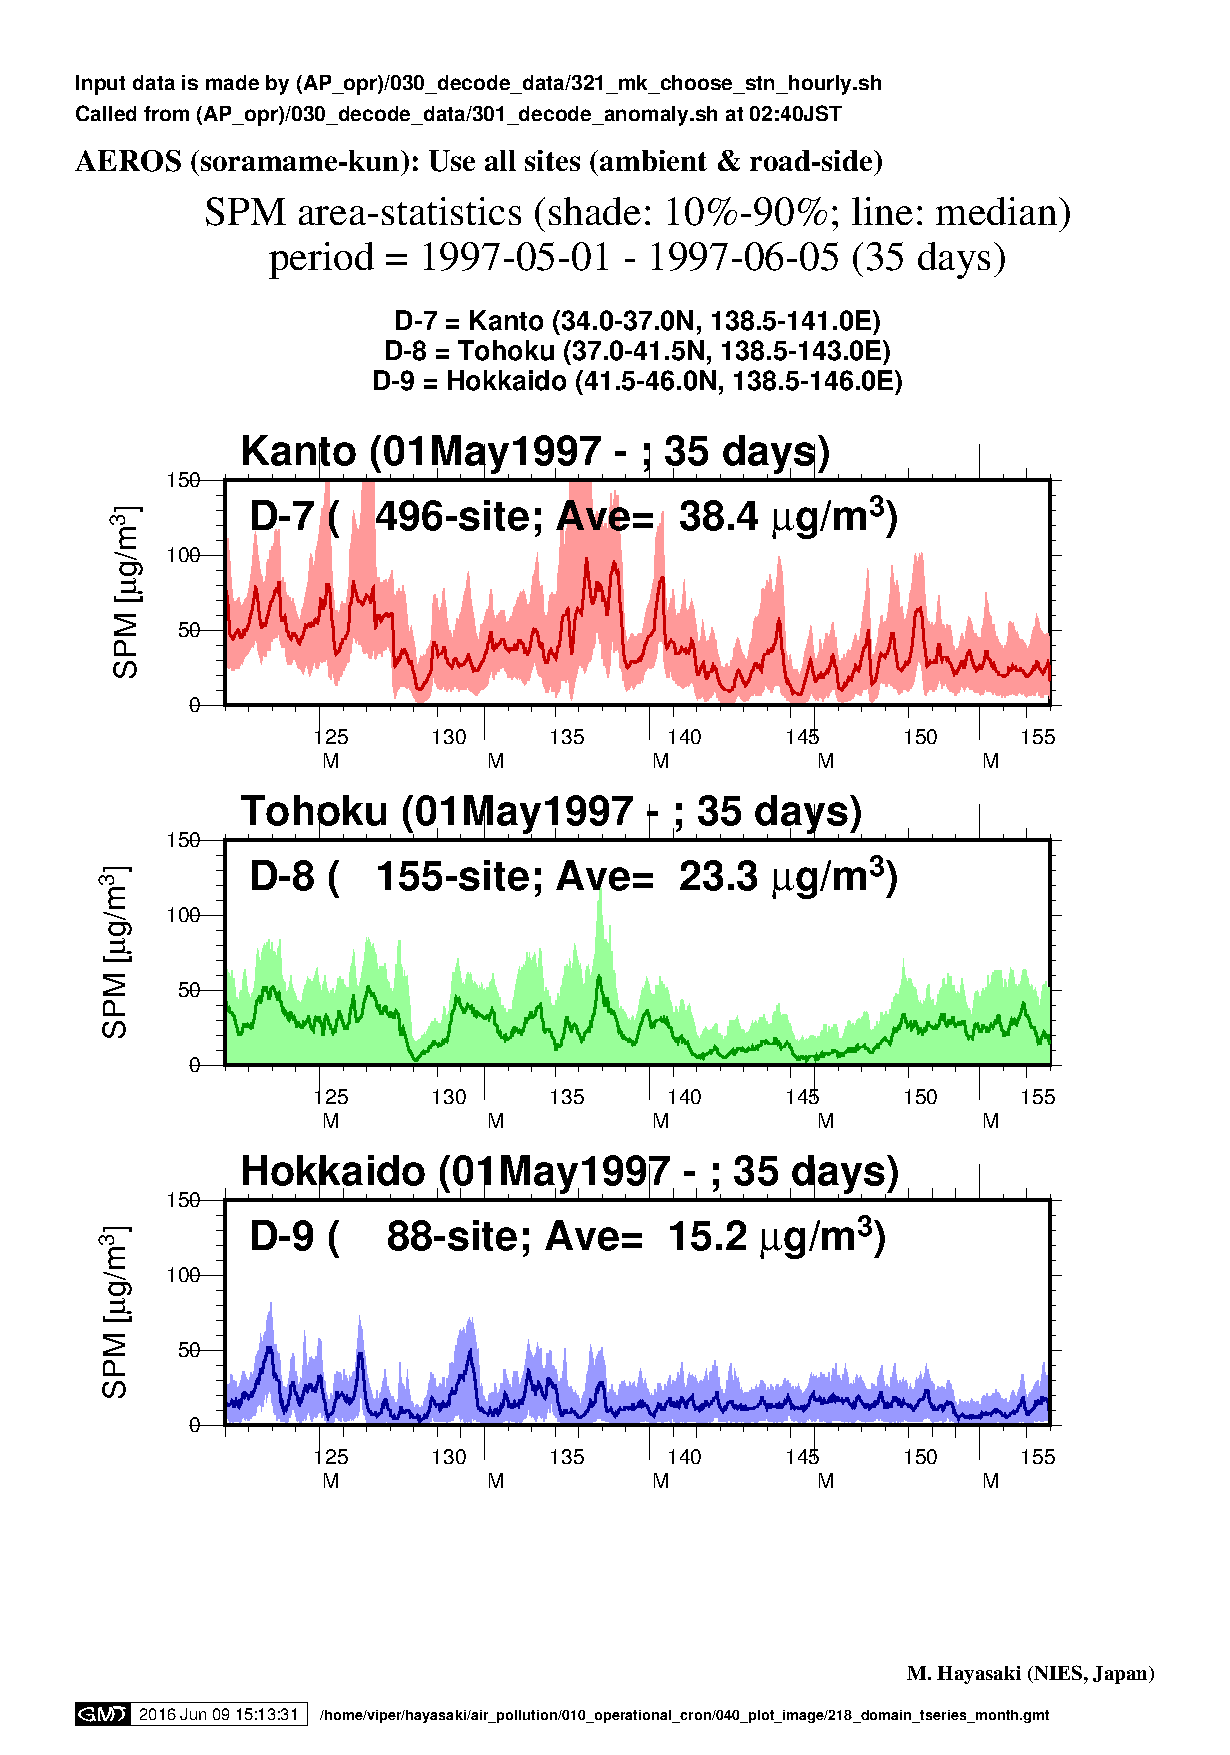
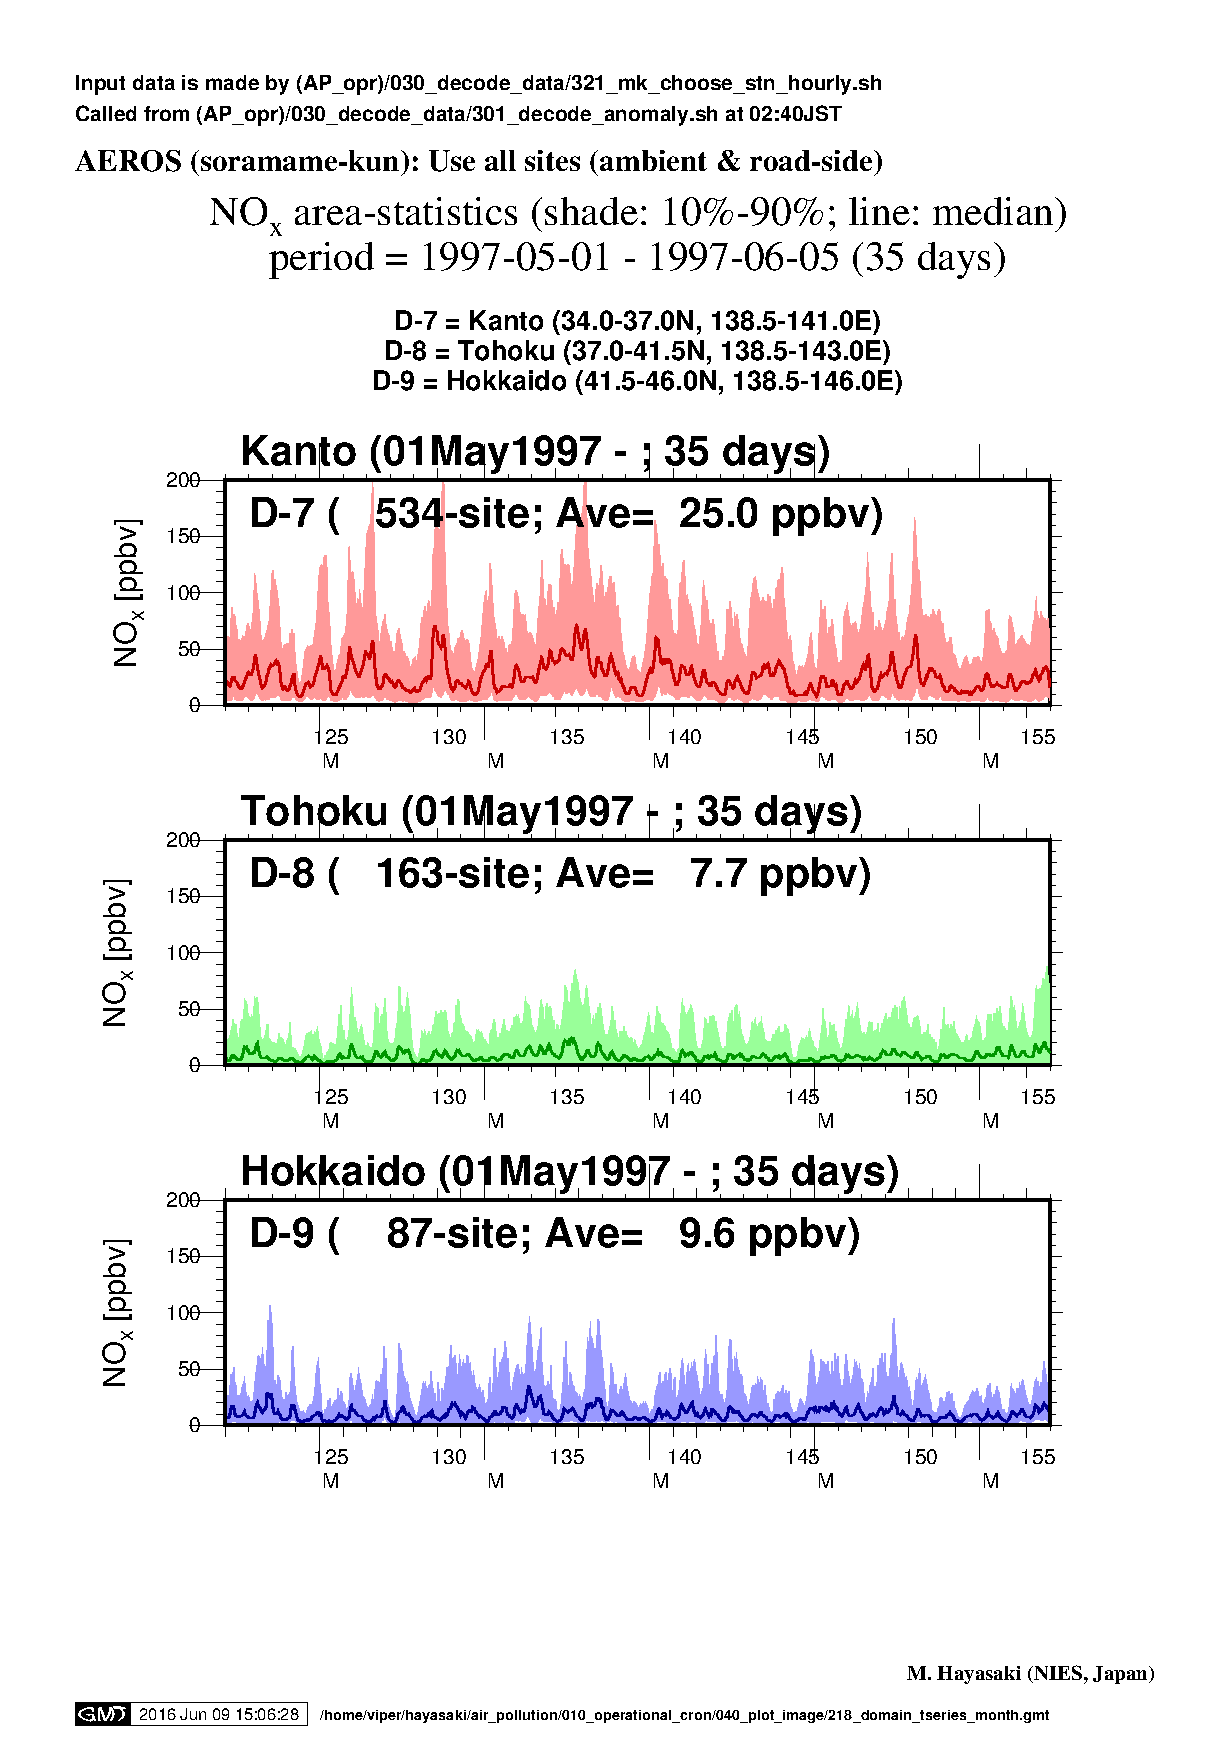
| May1997 (D1 - 3) |

|
|
NA |
|
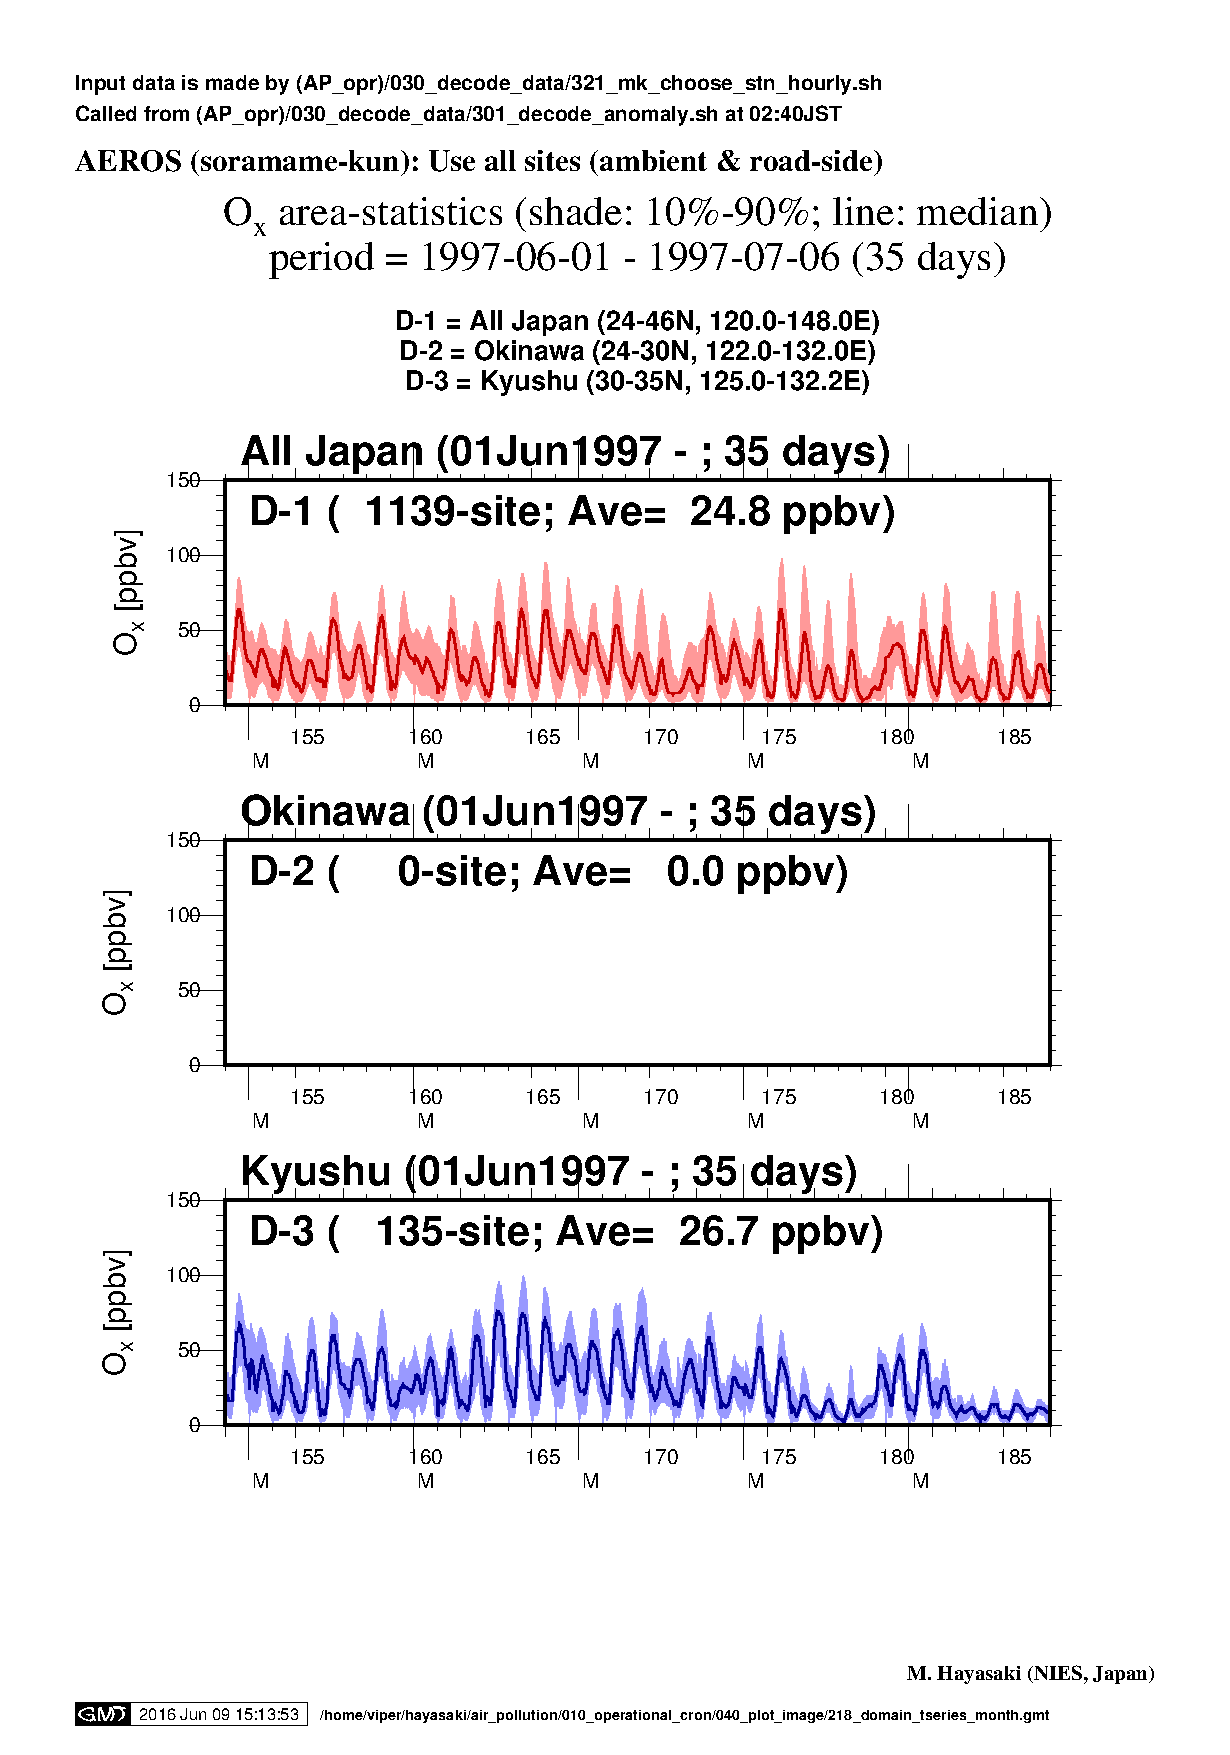
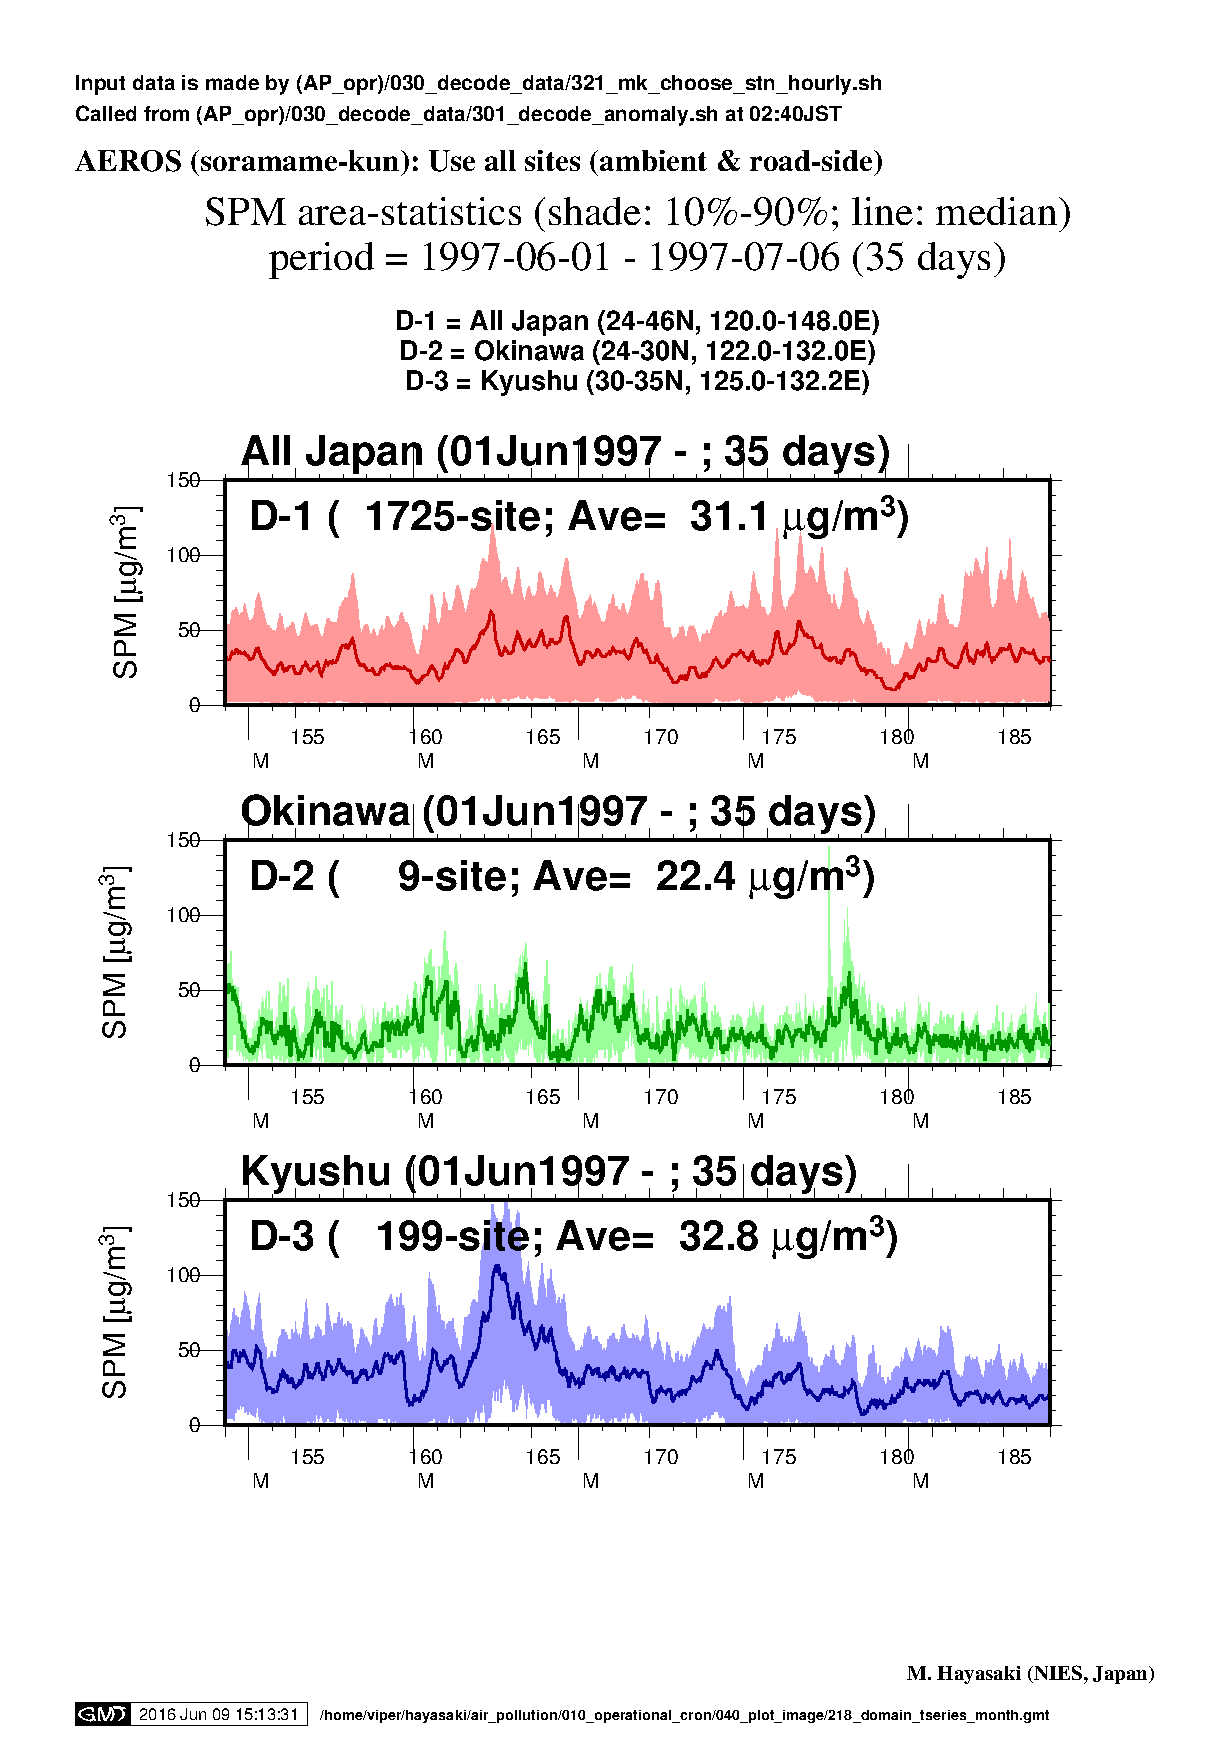
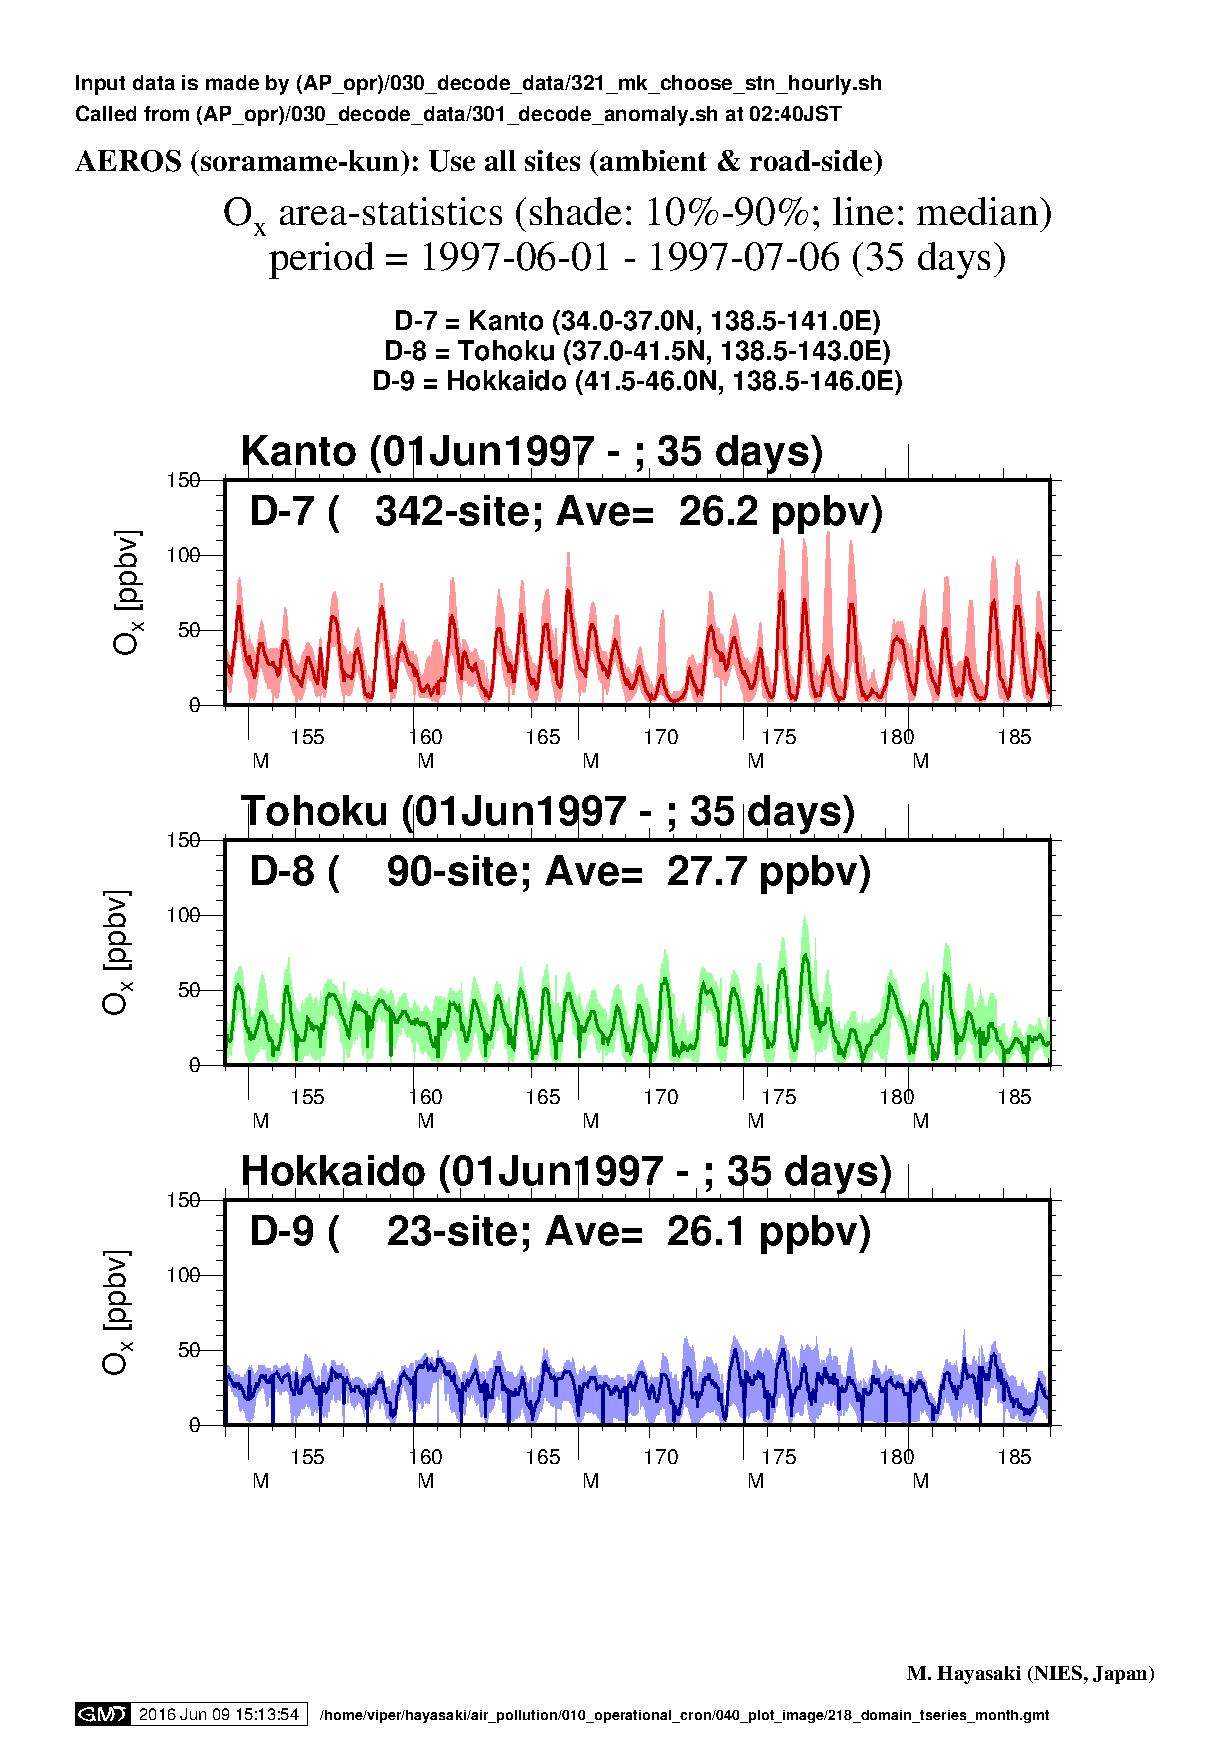
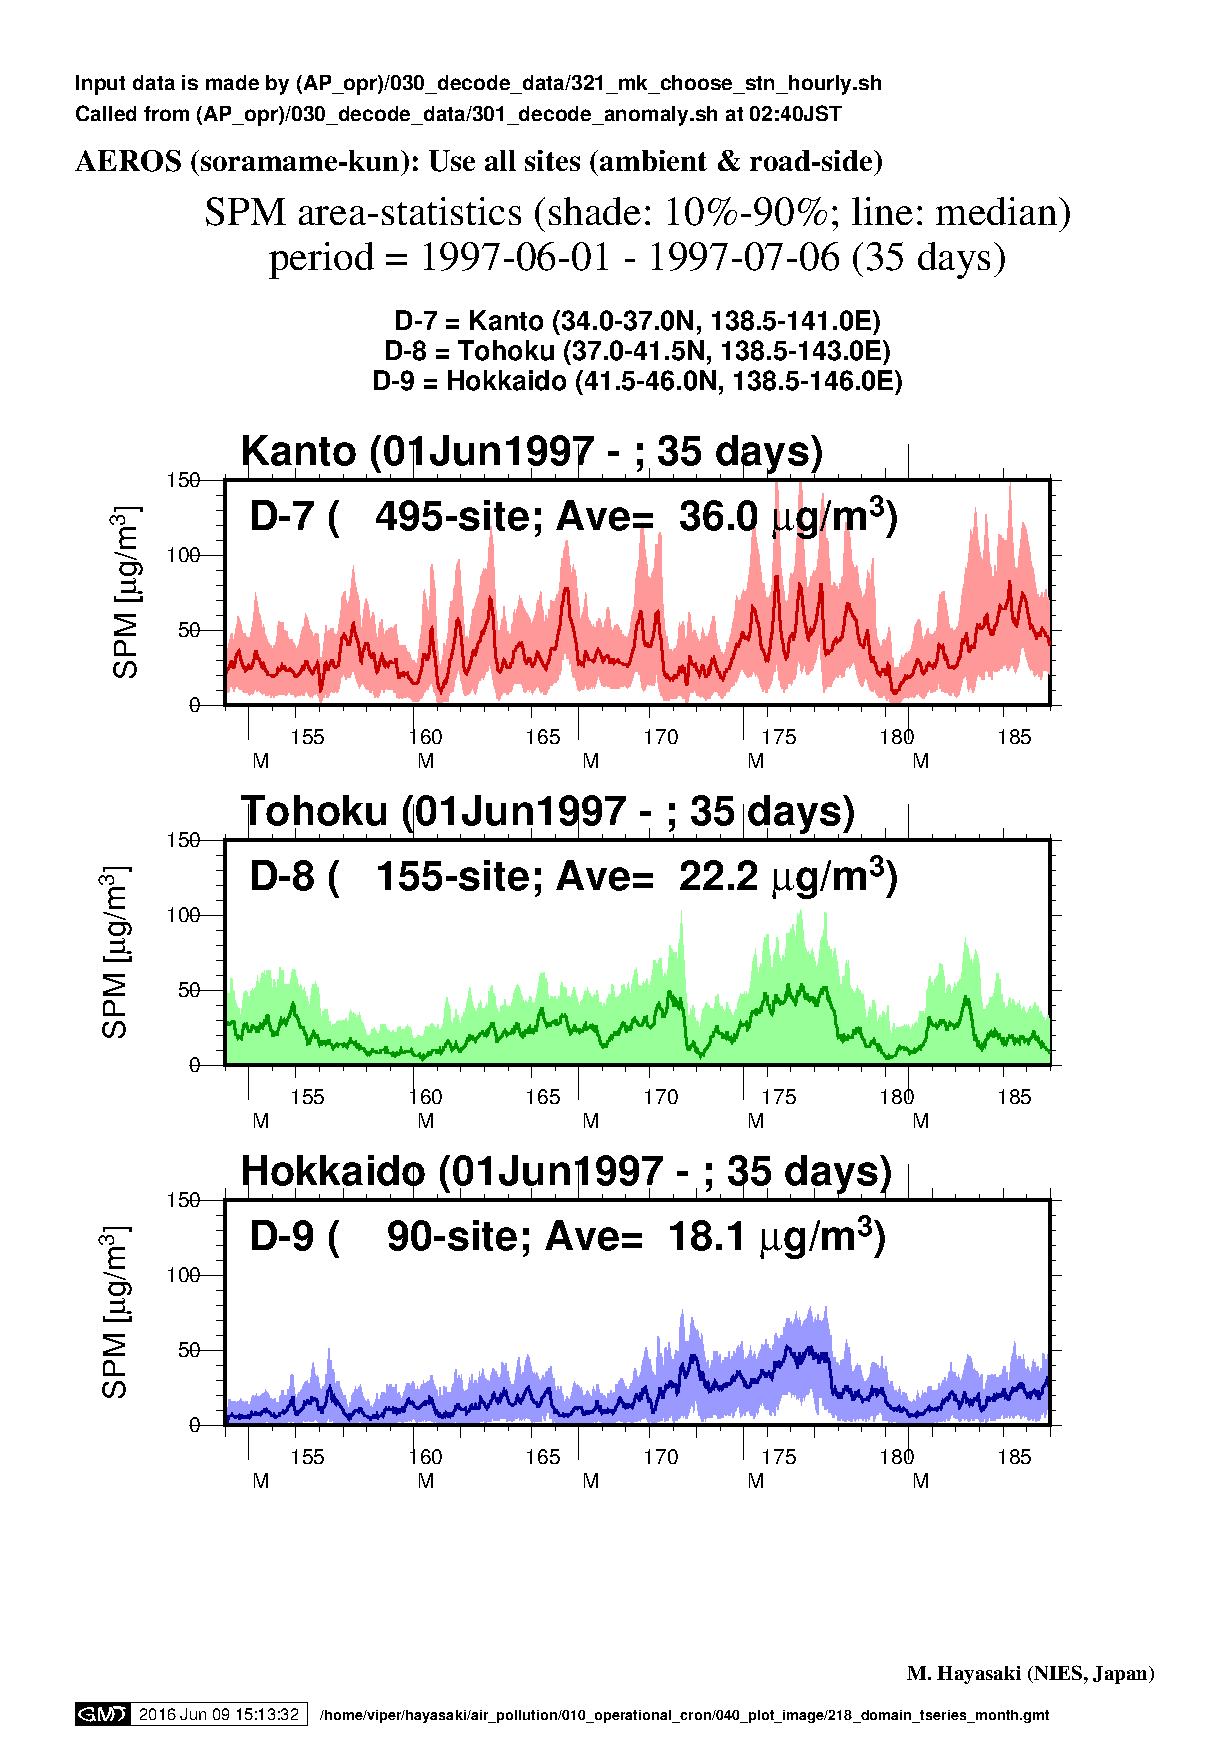
| Jun1997 (D1 - 3) |
|
|
NA |
|
| Month | Ox | SPM | PM2.5 | NOx |
| Jul1997 (D1 - 3) |
|
|
NA |
|
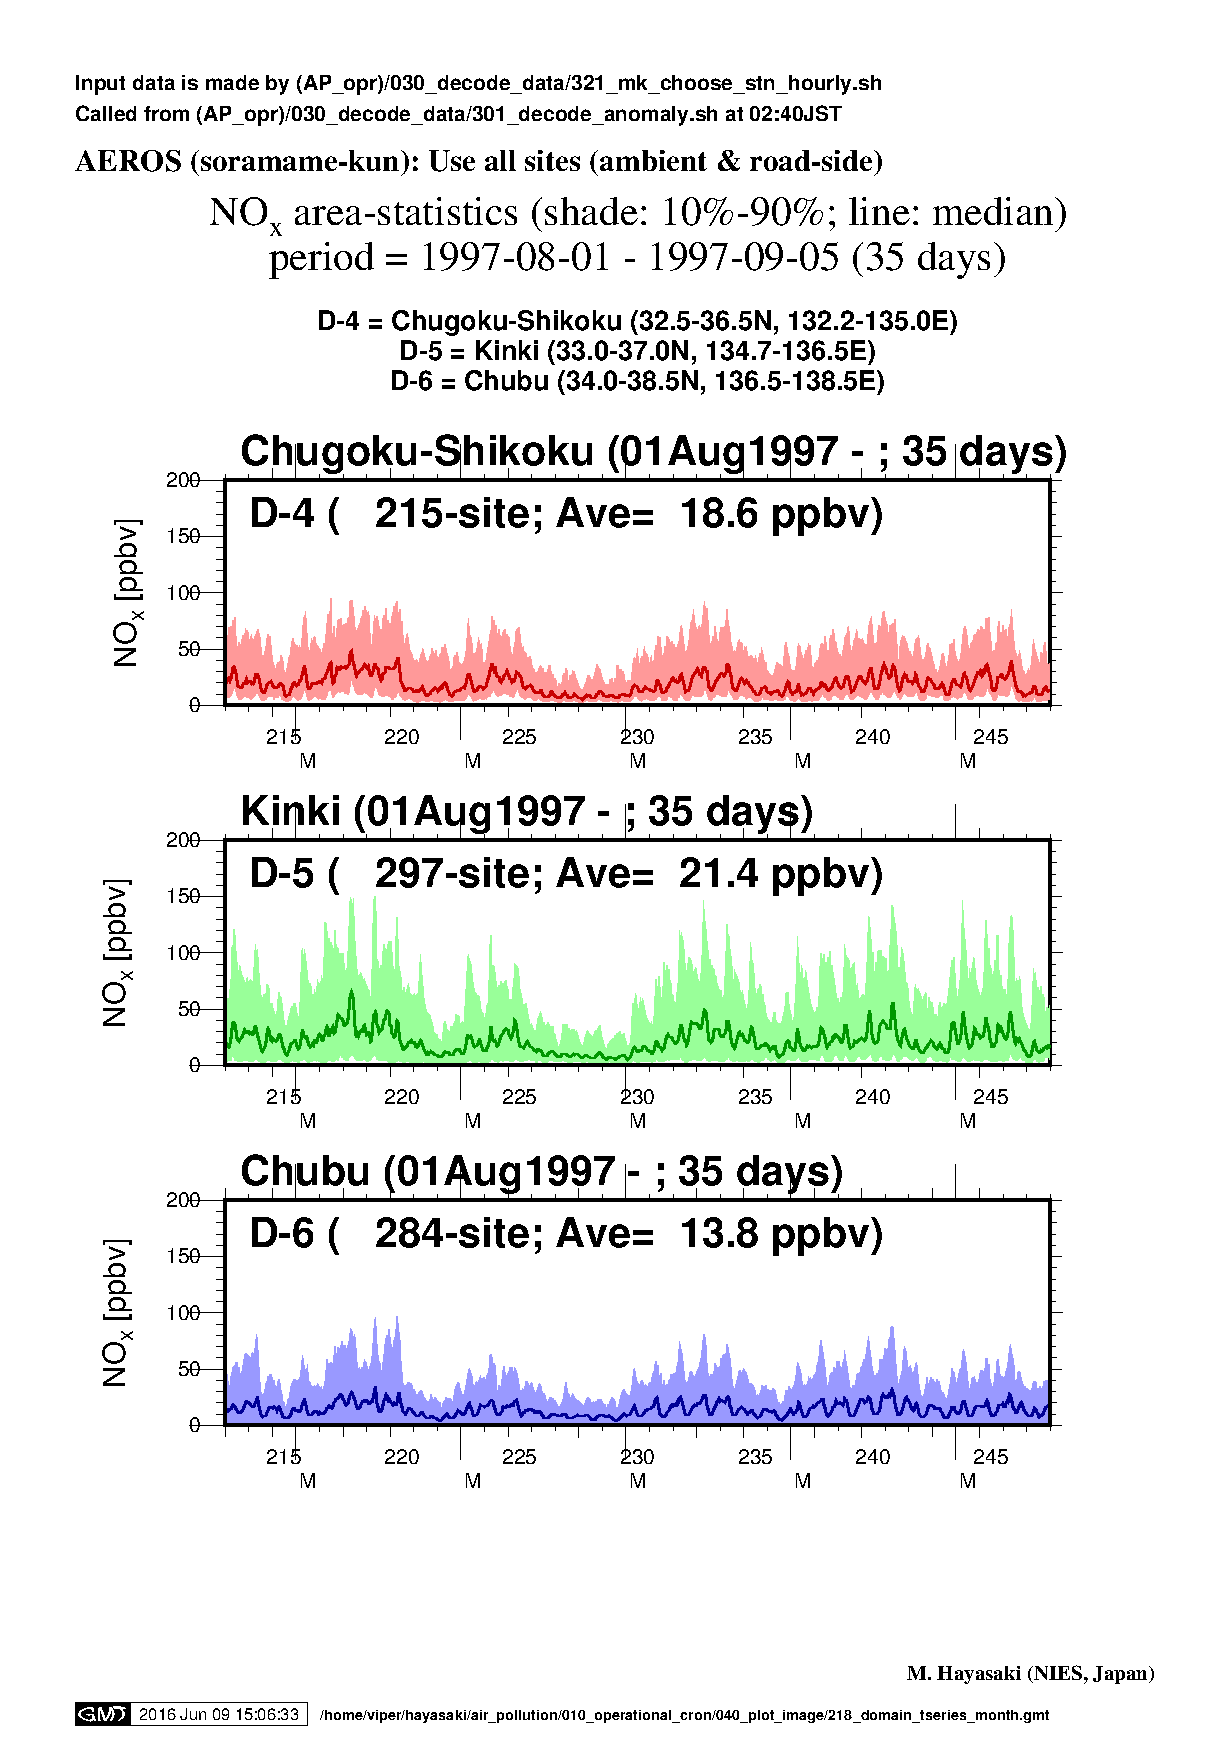
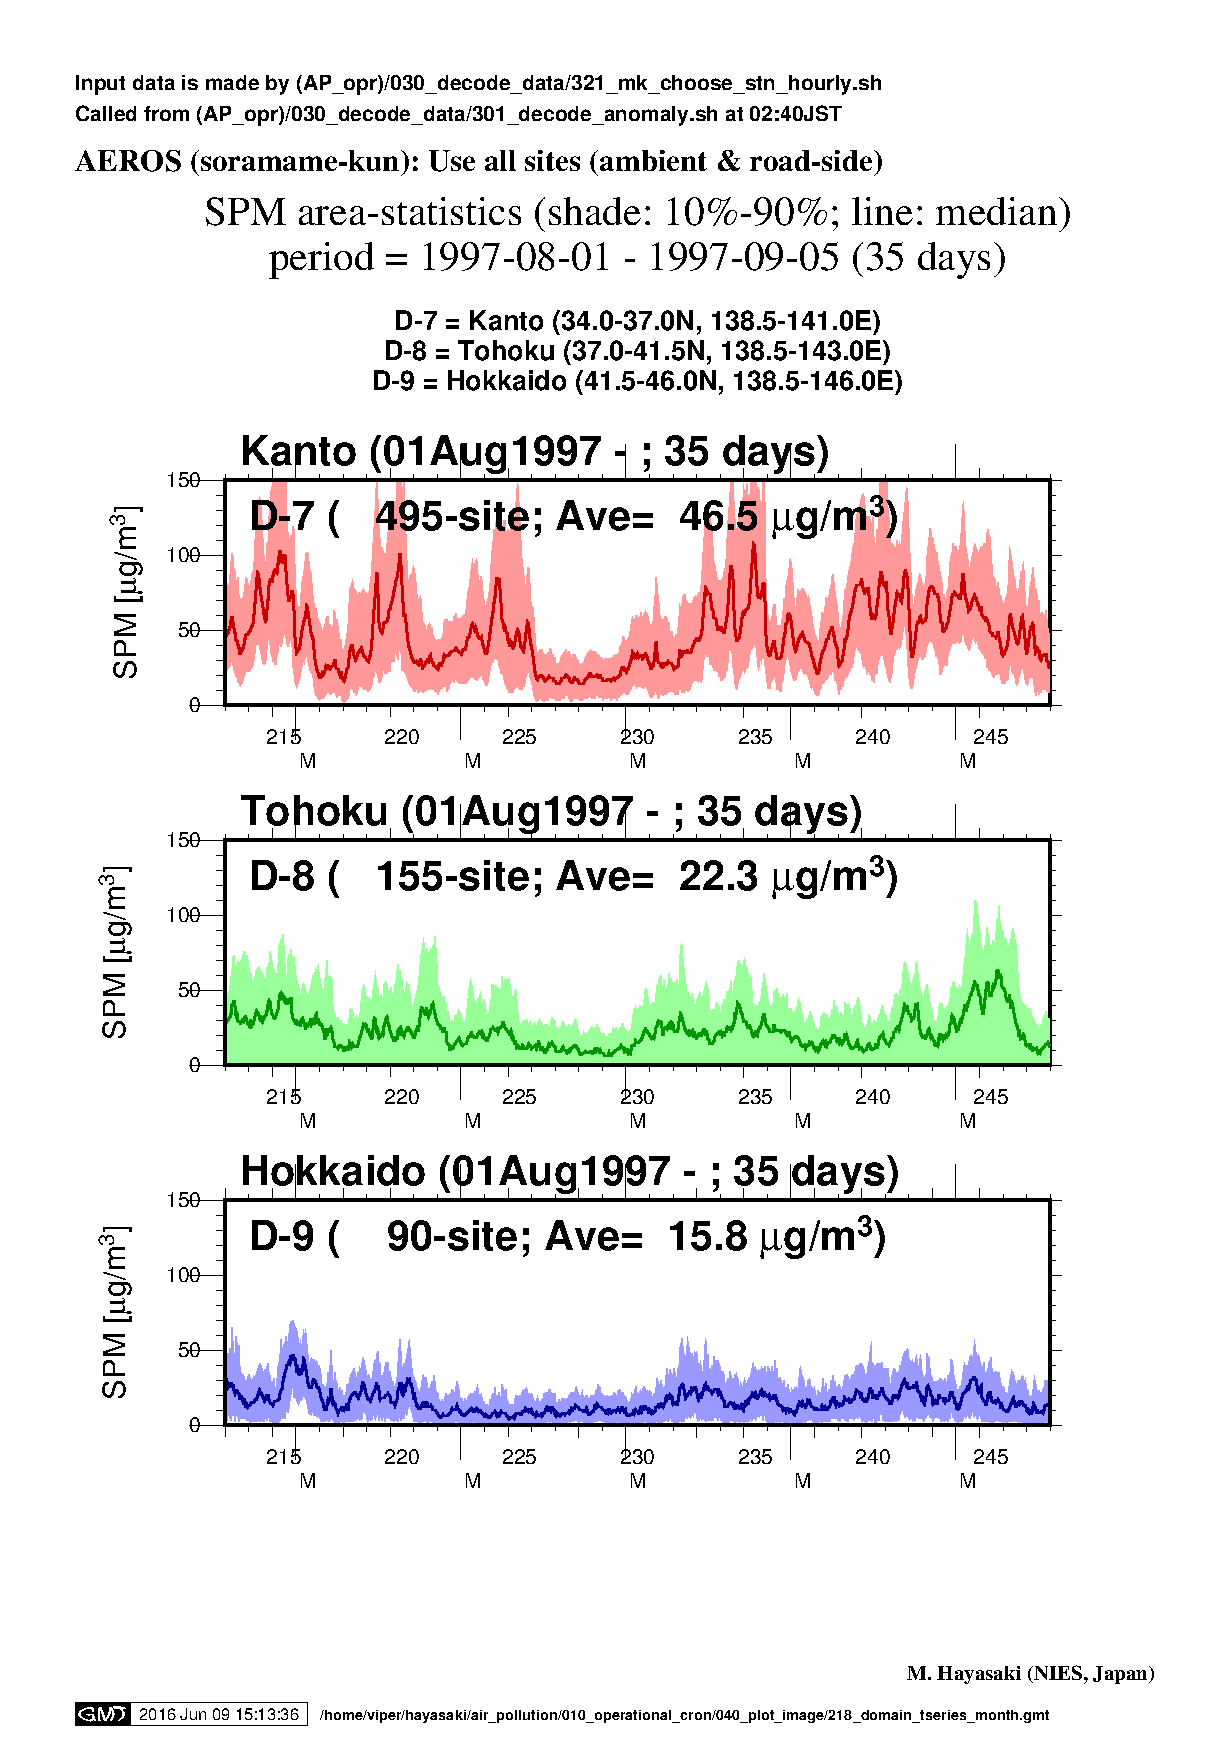
| Aug1997 (D1 - 3) |
|
|
NA |
|
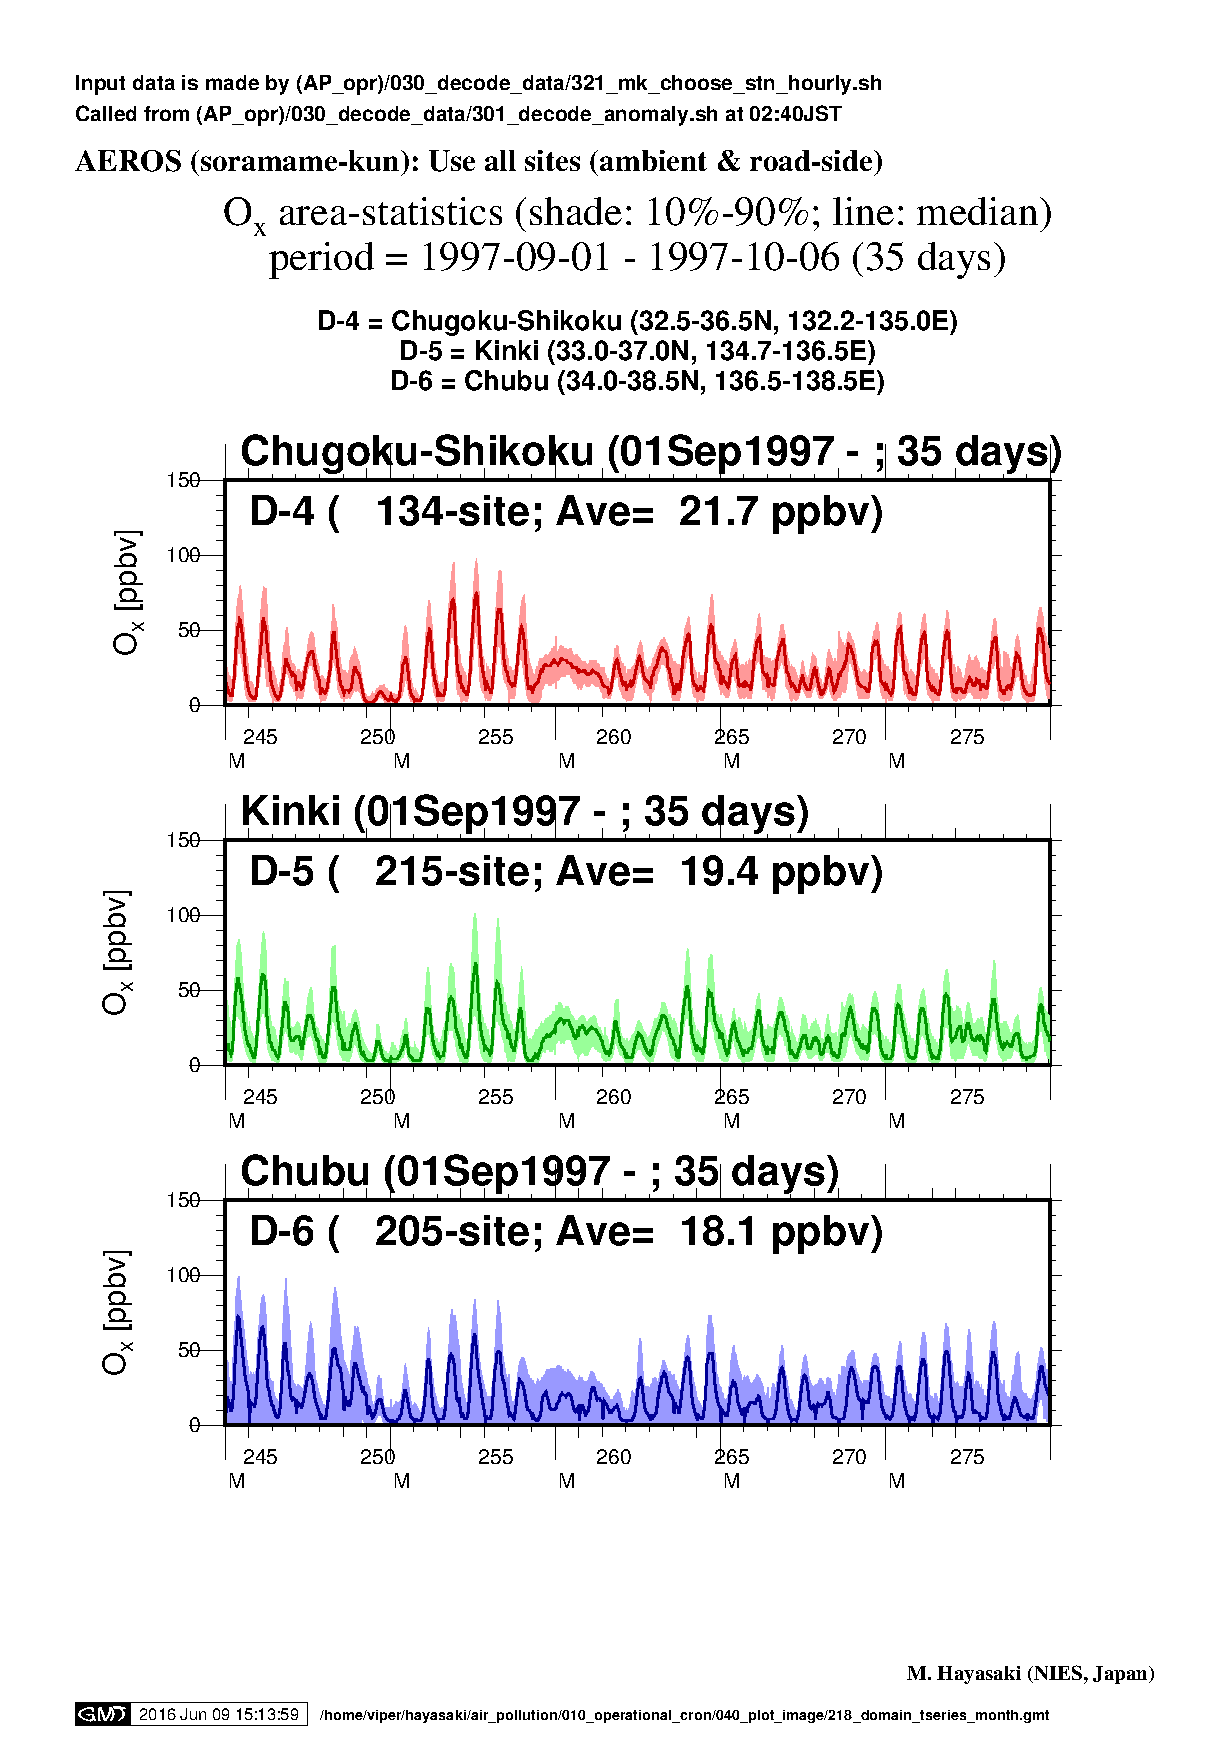
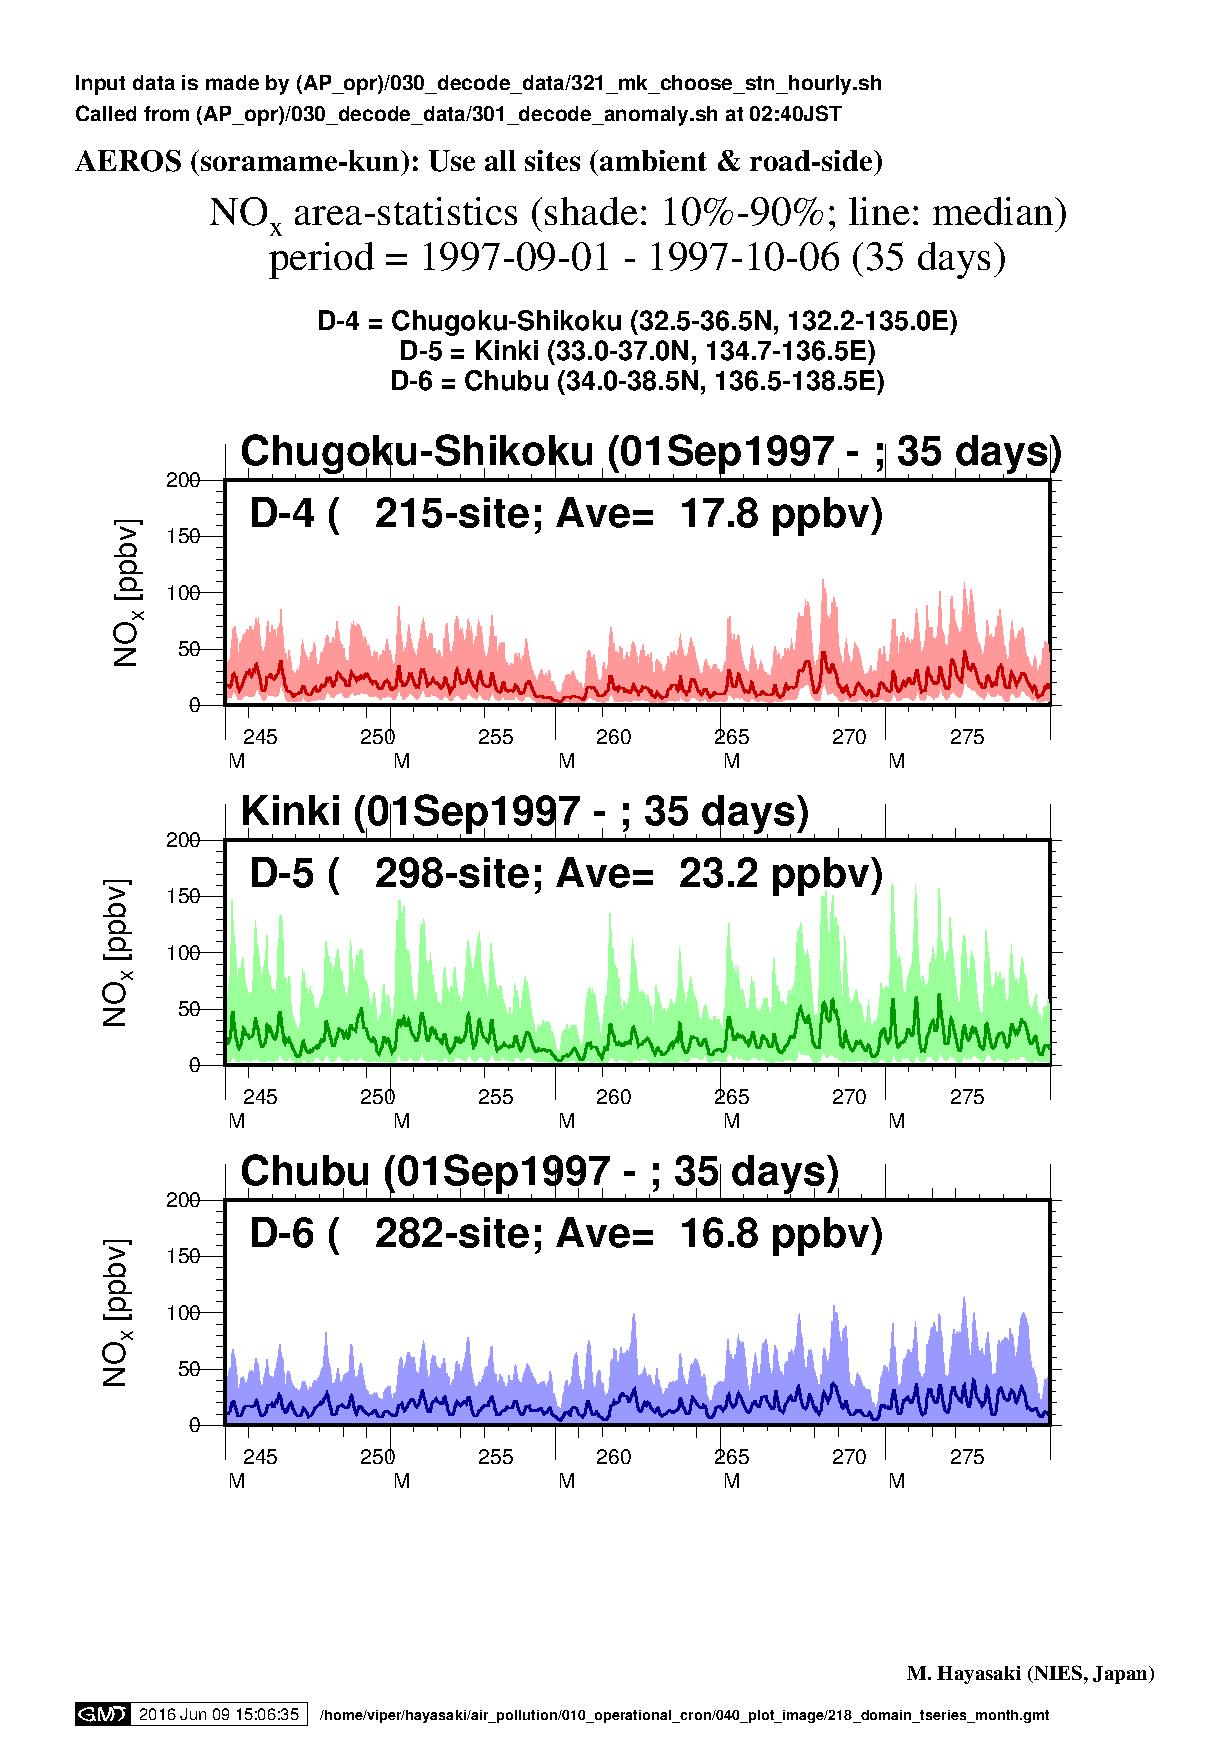
| Sep1997 (D1 - 3) |

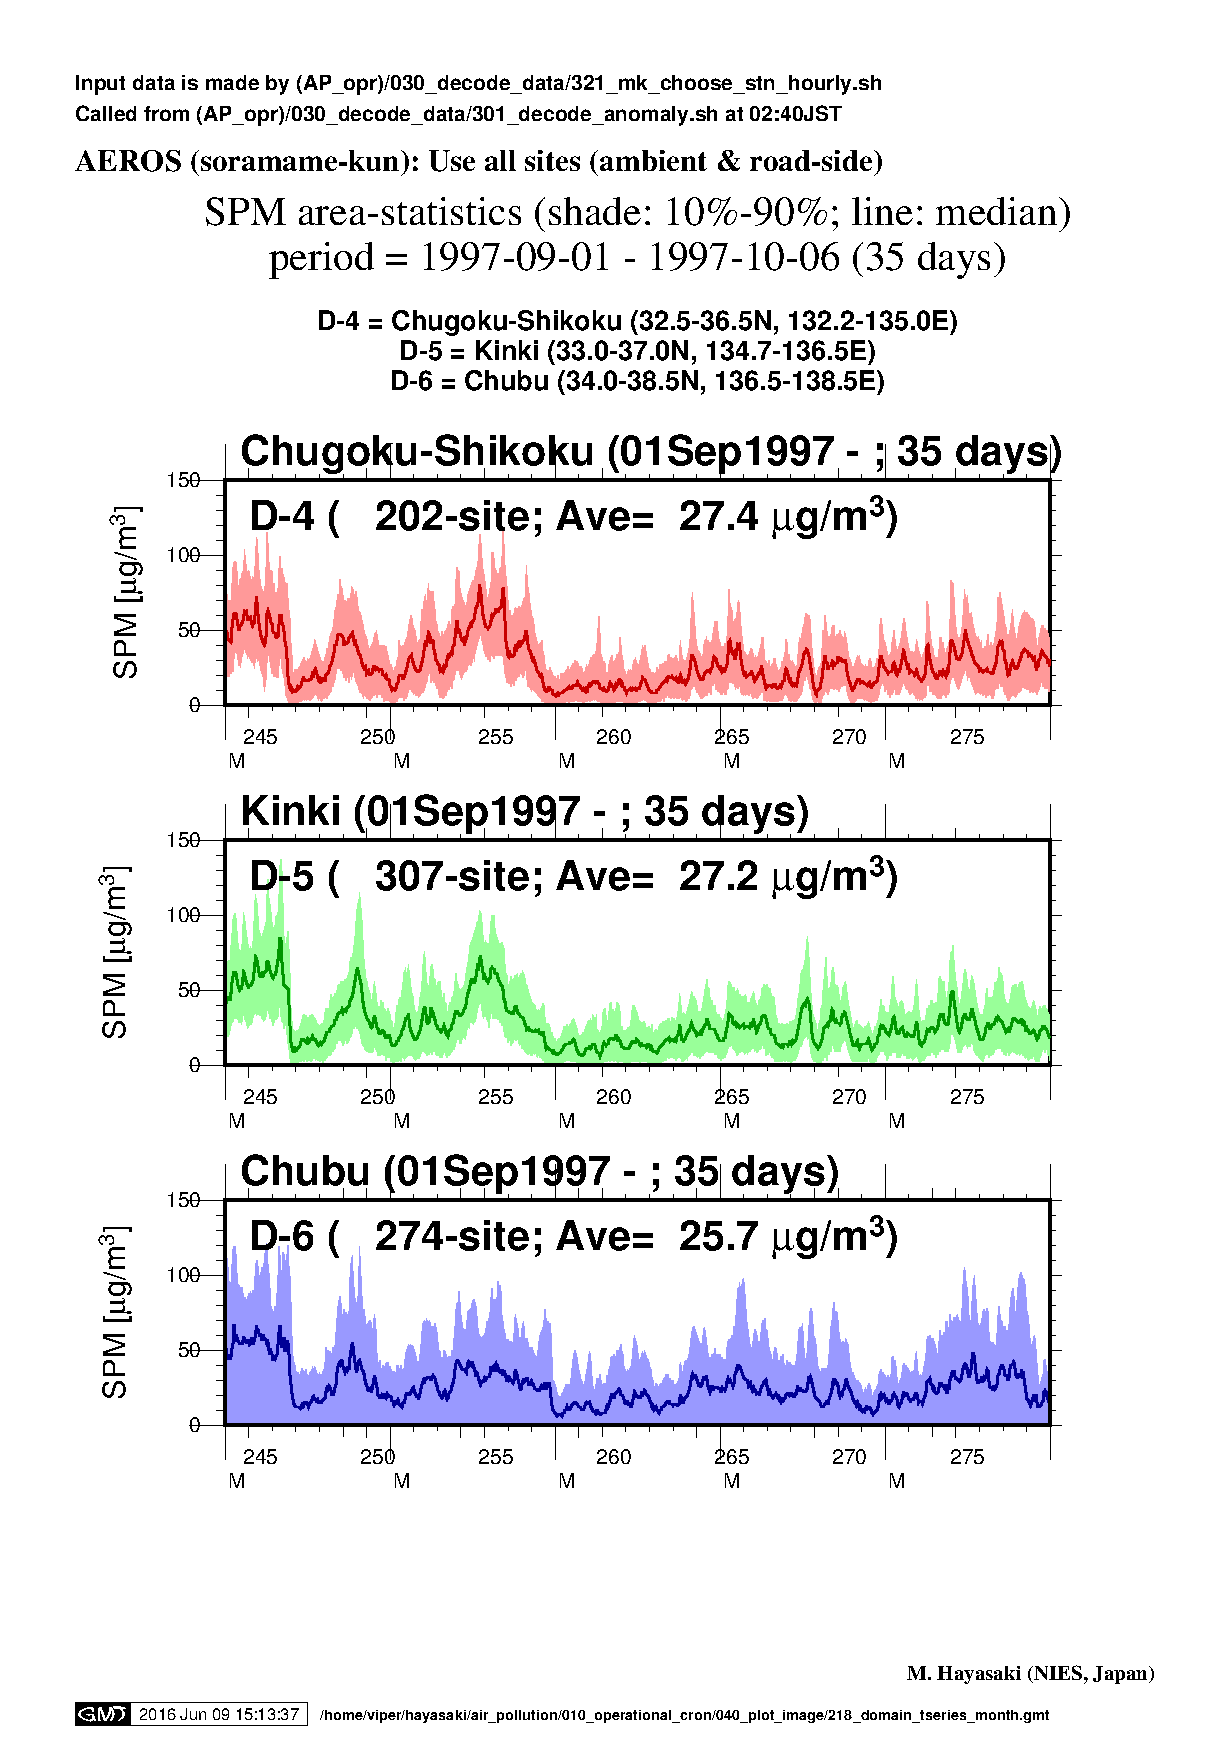
|
|
NA |
|
| Month | Ox | SPM | PM2.5 | NOx |
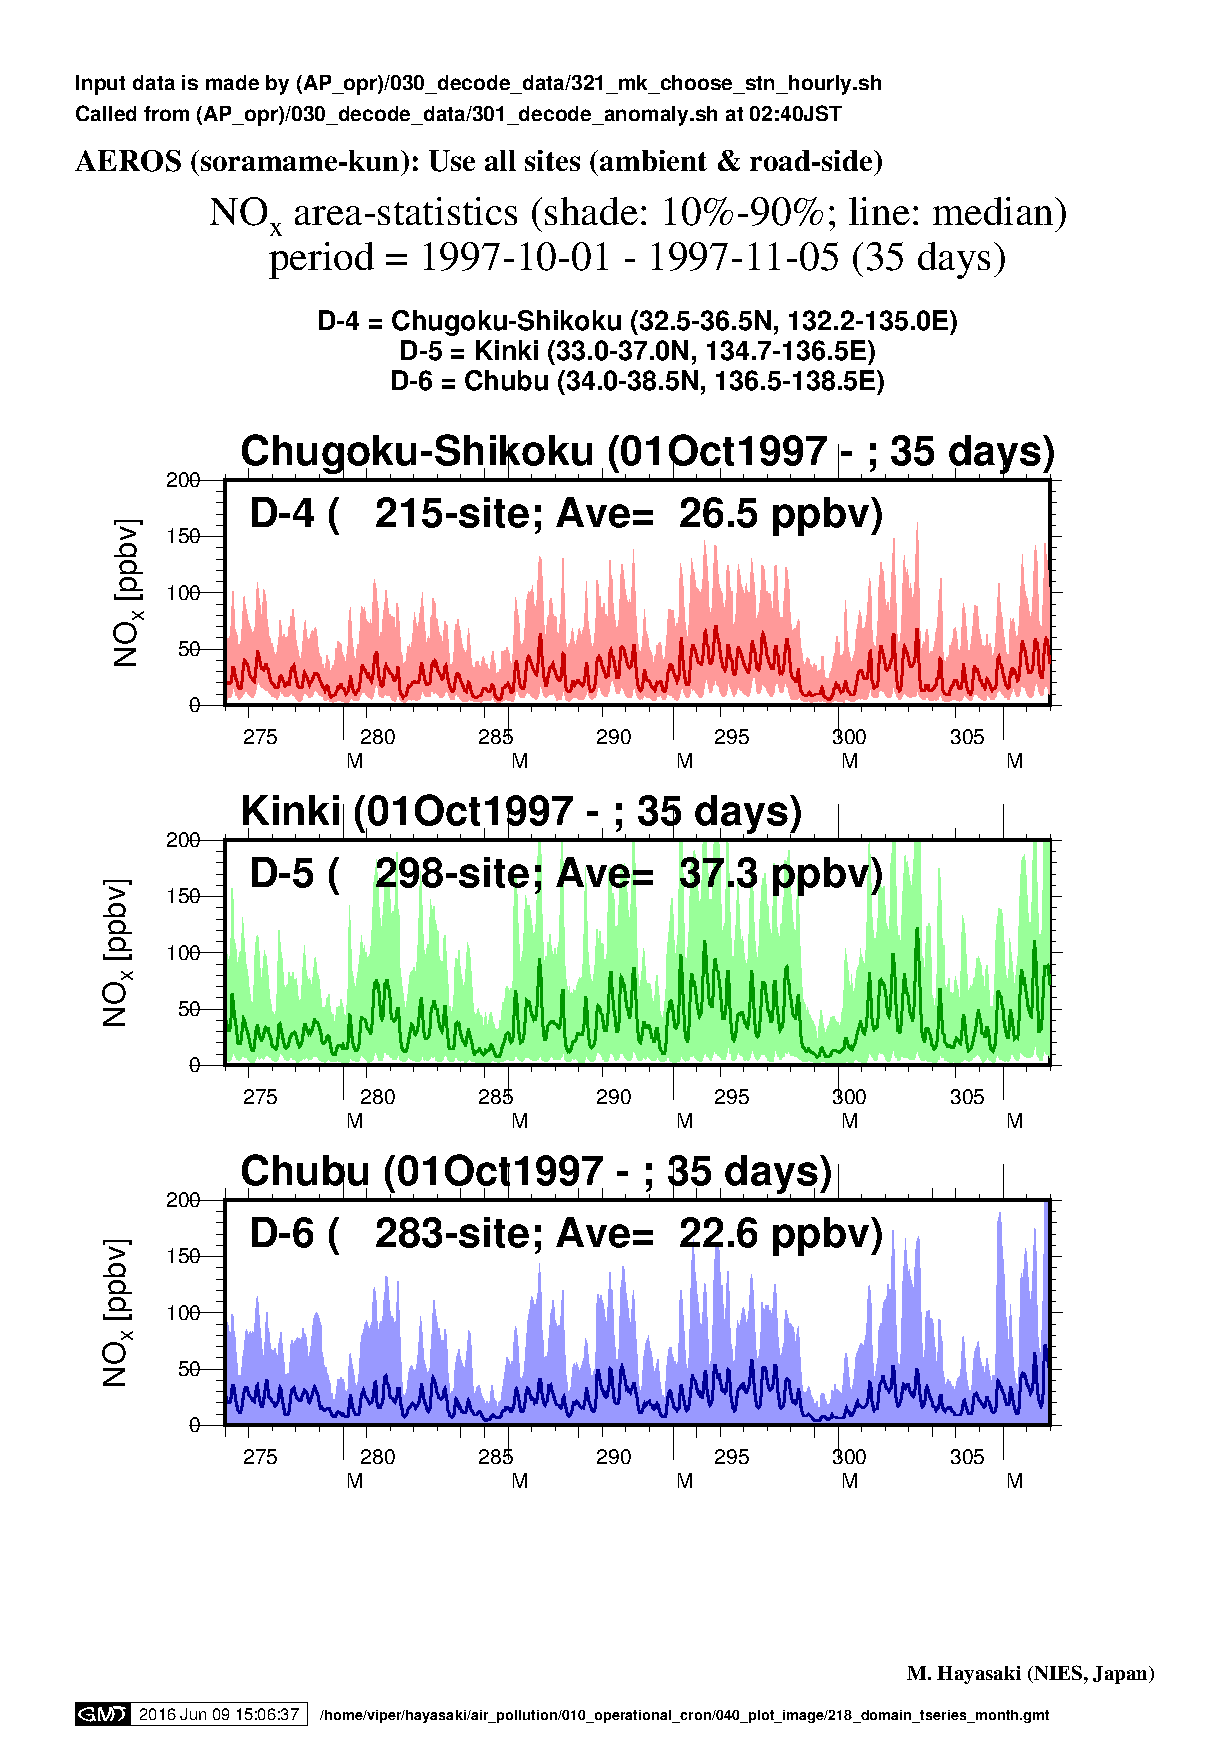
| Oct1997 (D1 - 3) |

|
|
NA |
|
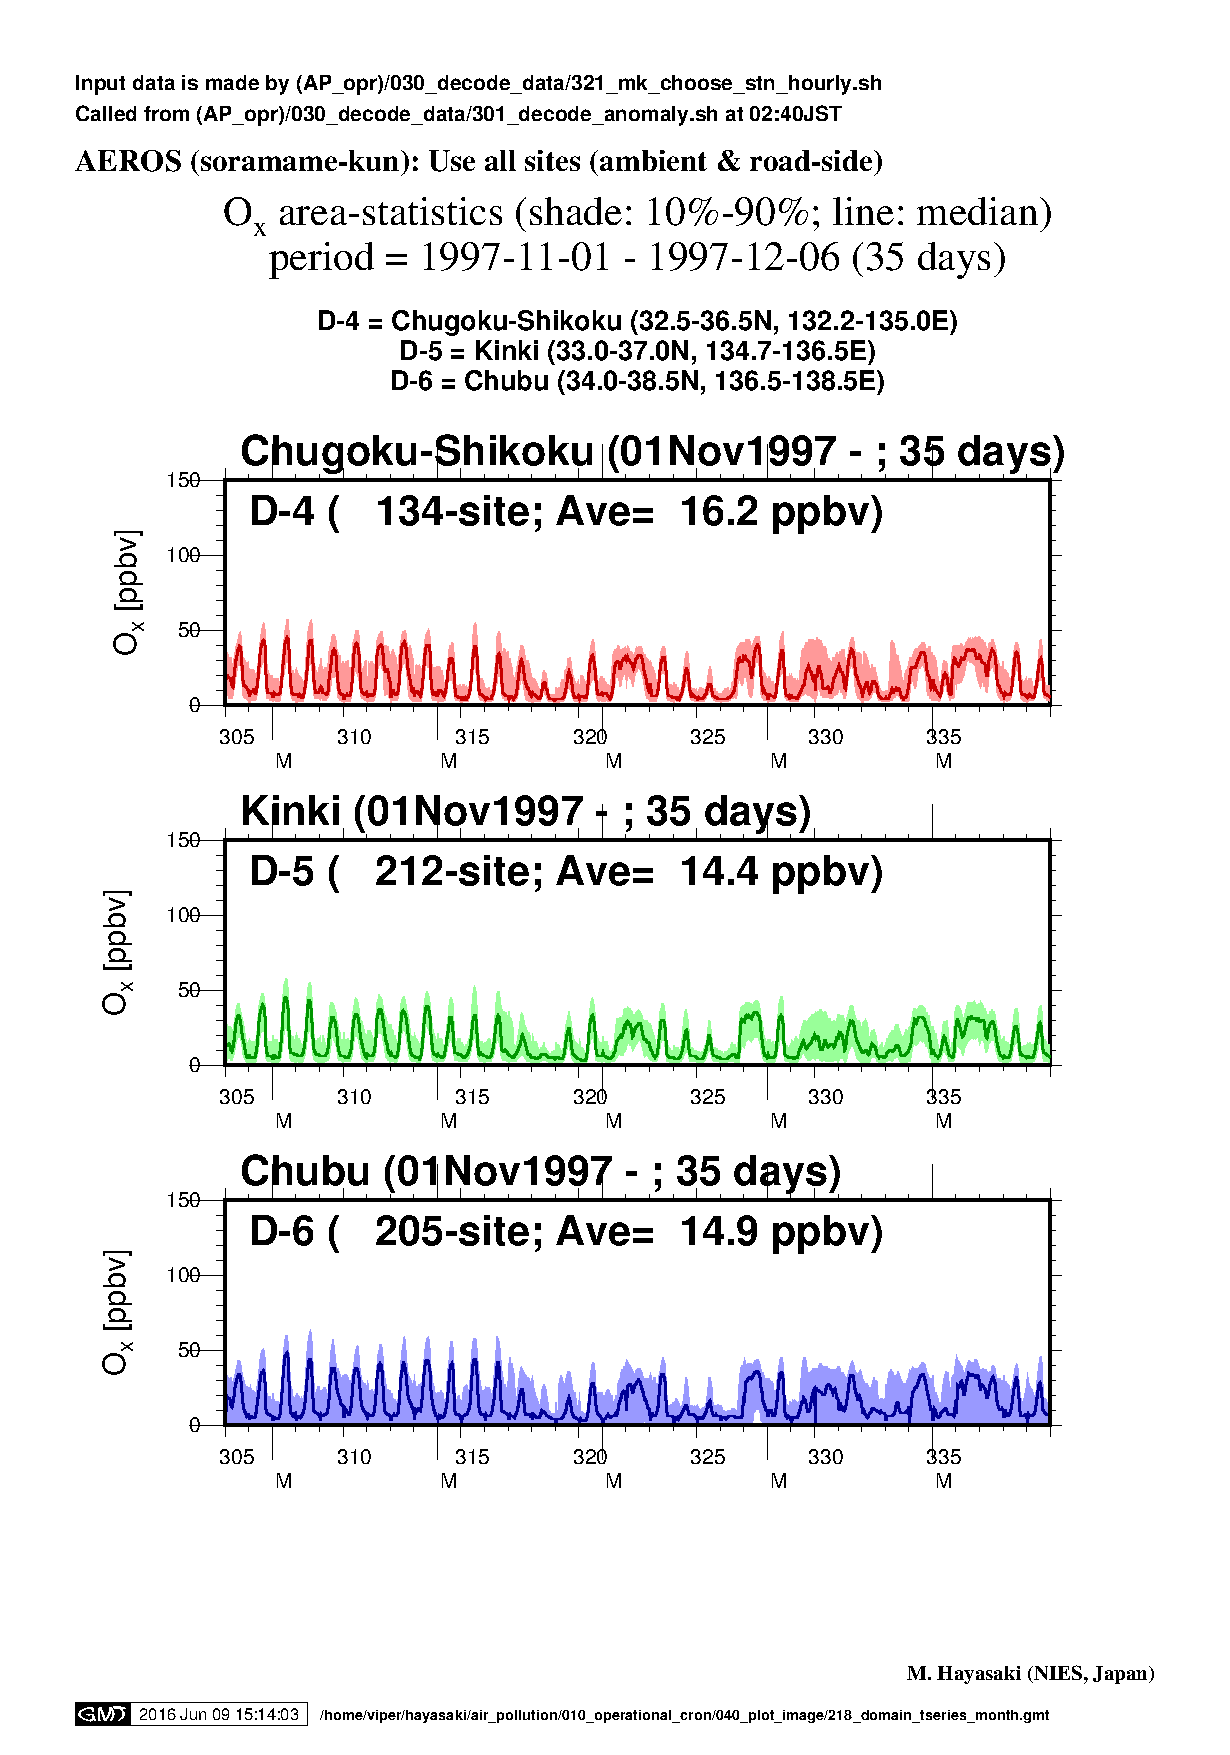
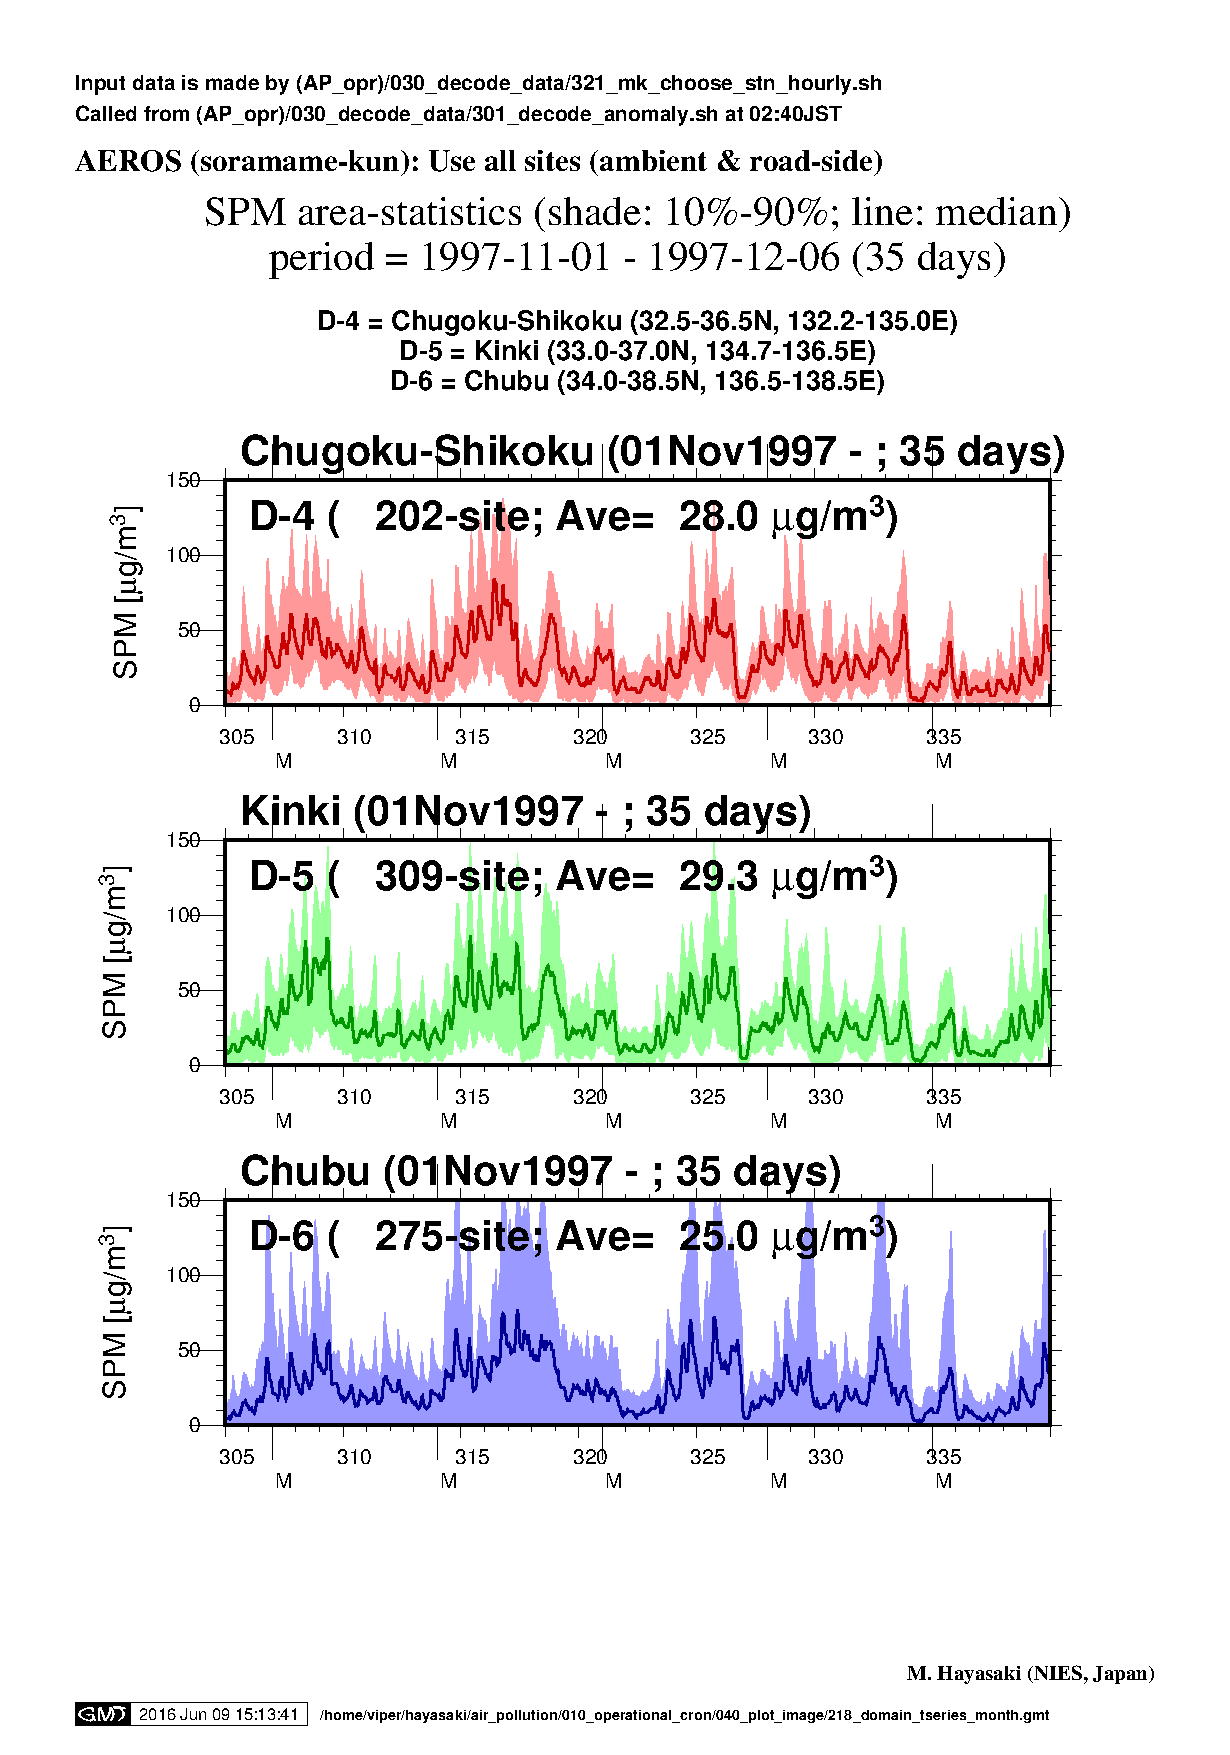
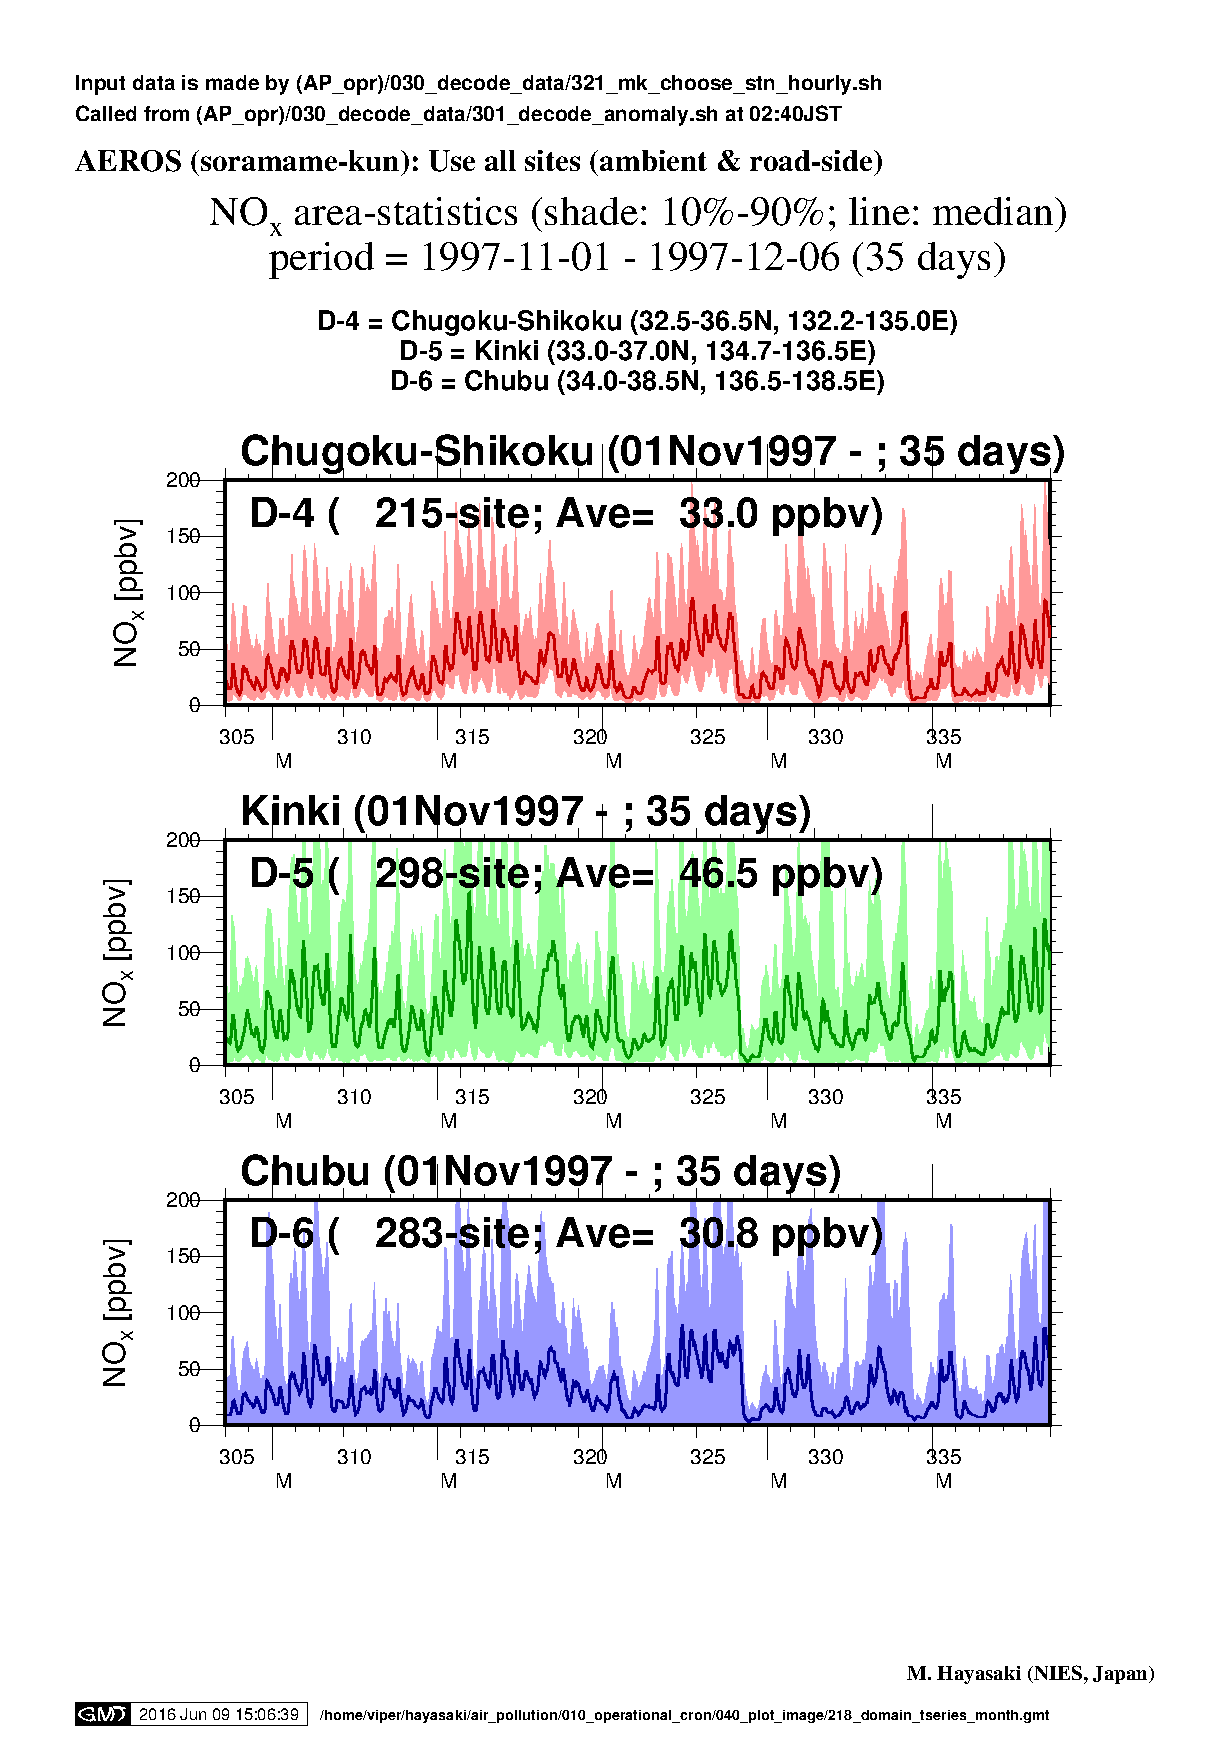
| Nov1997 (D1 - 3) |
|
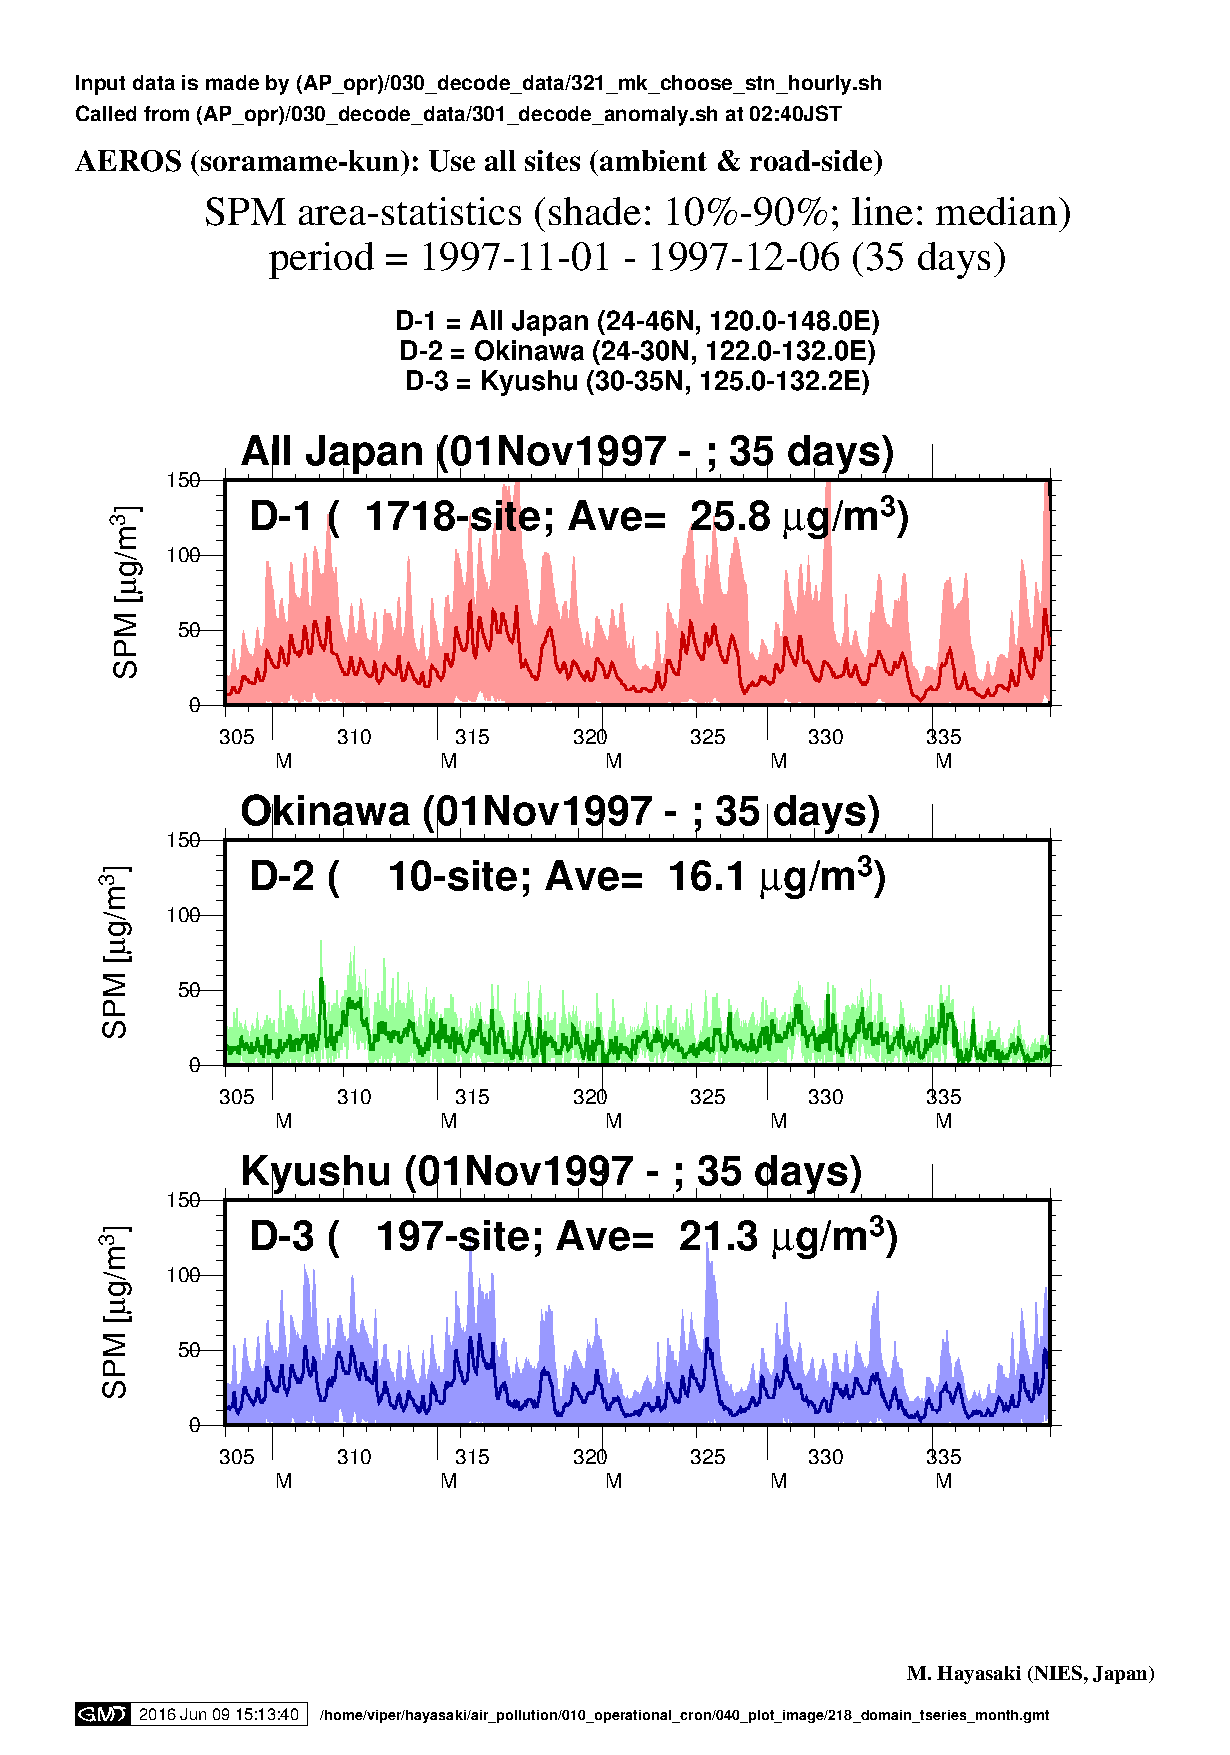
|
NA |
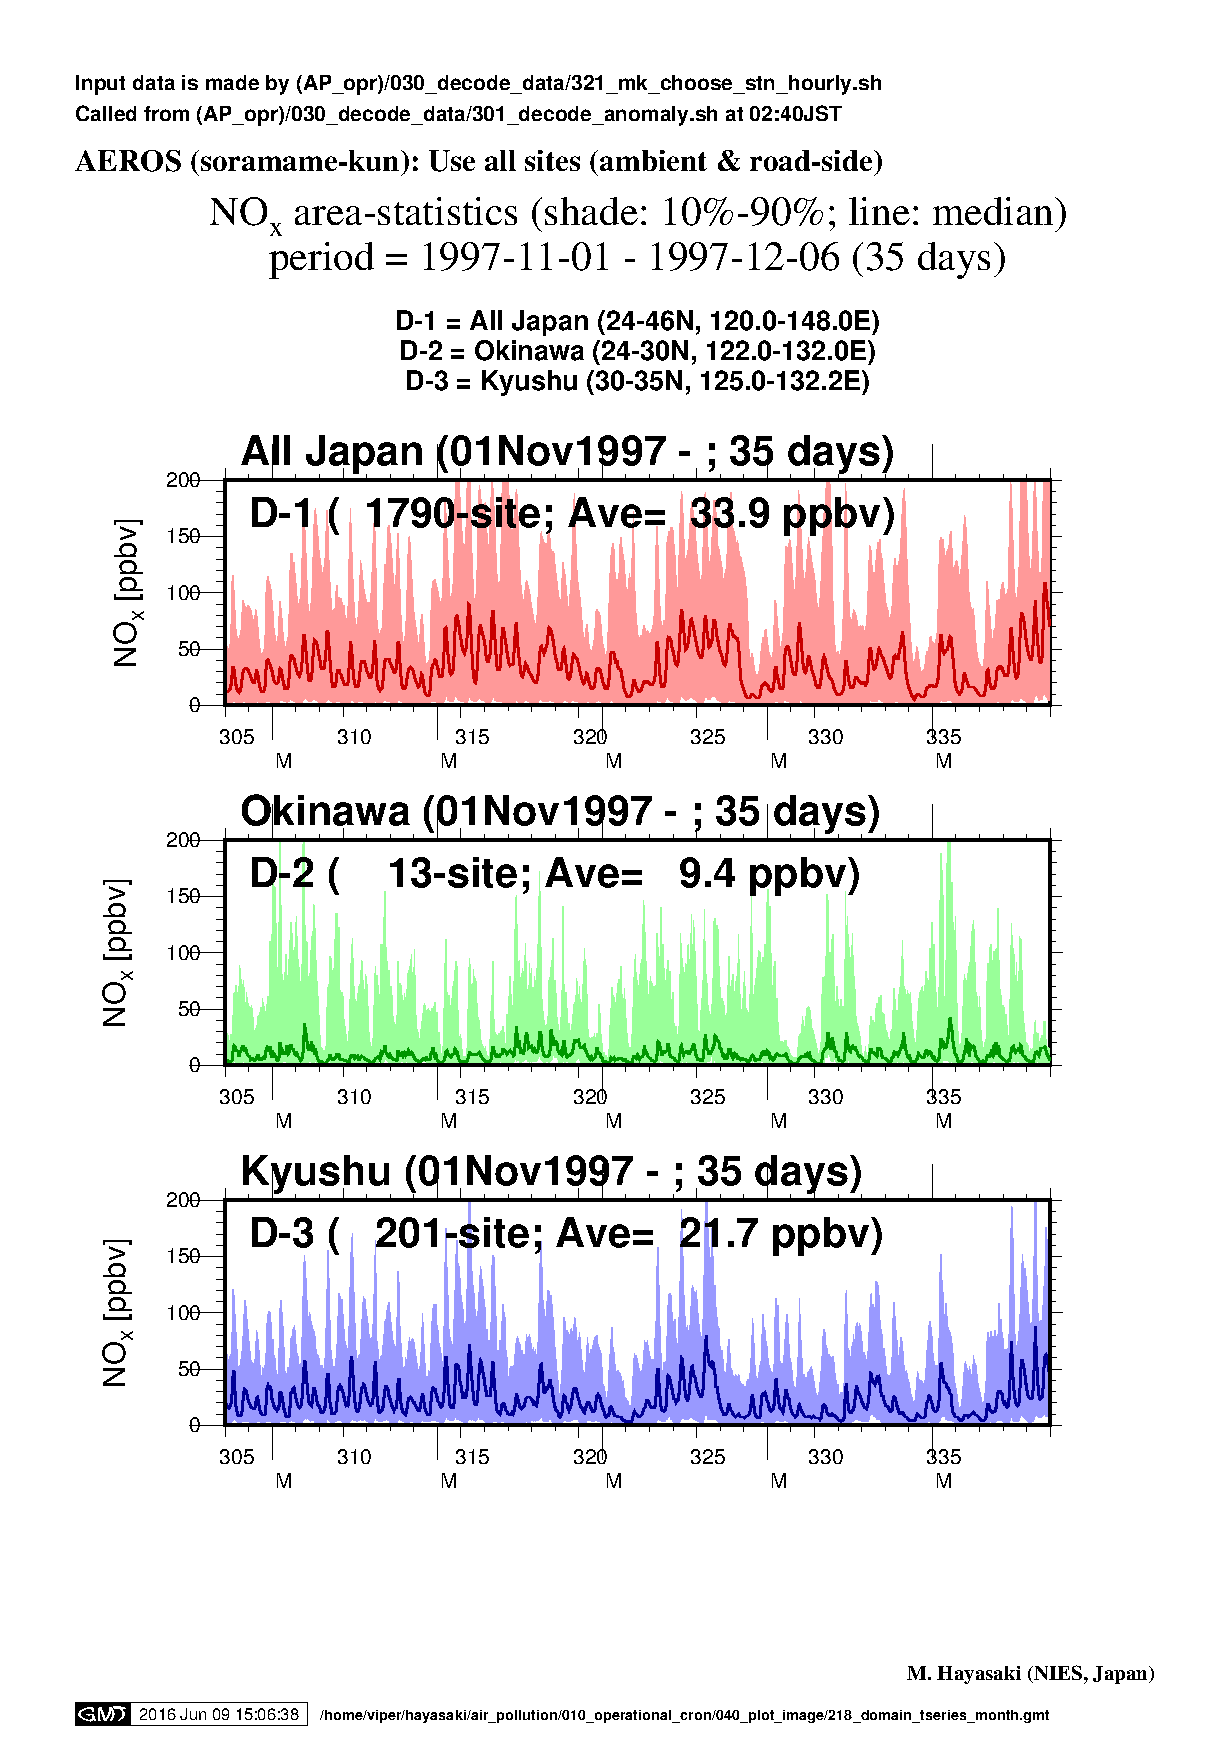
|
| Dec1997 (D1 - 3) |
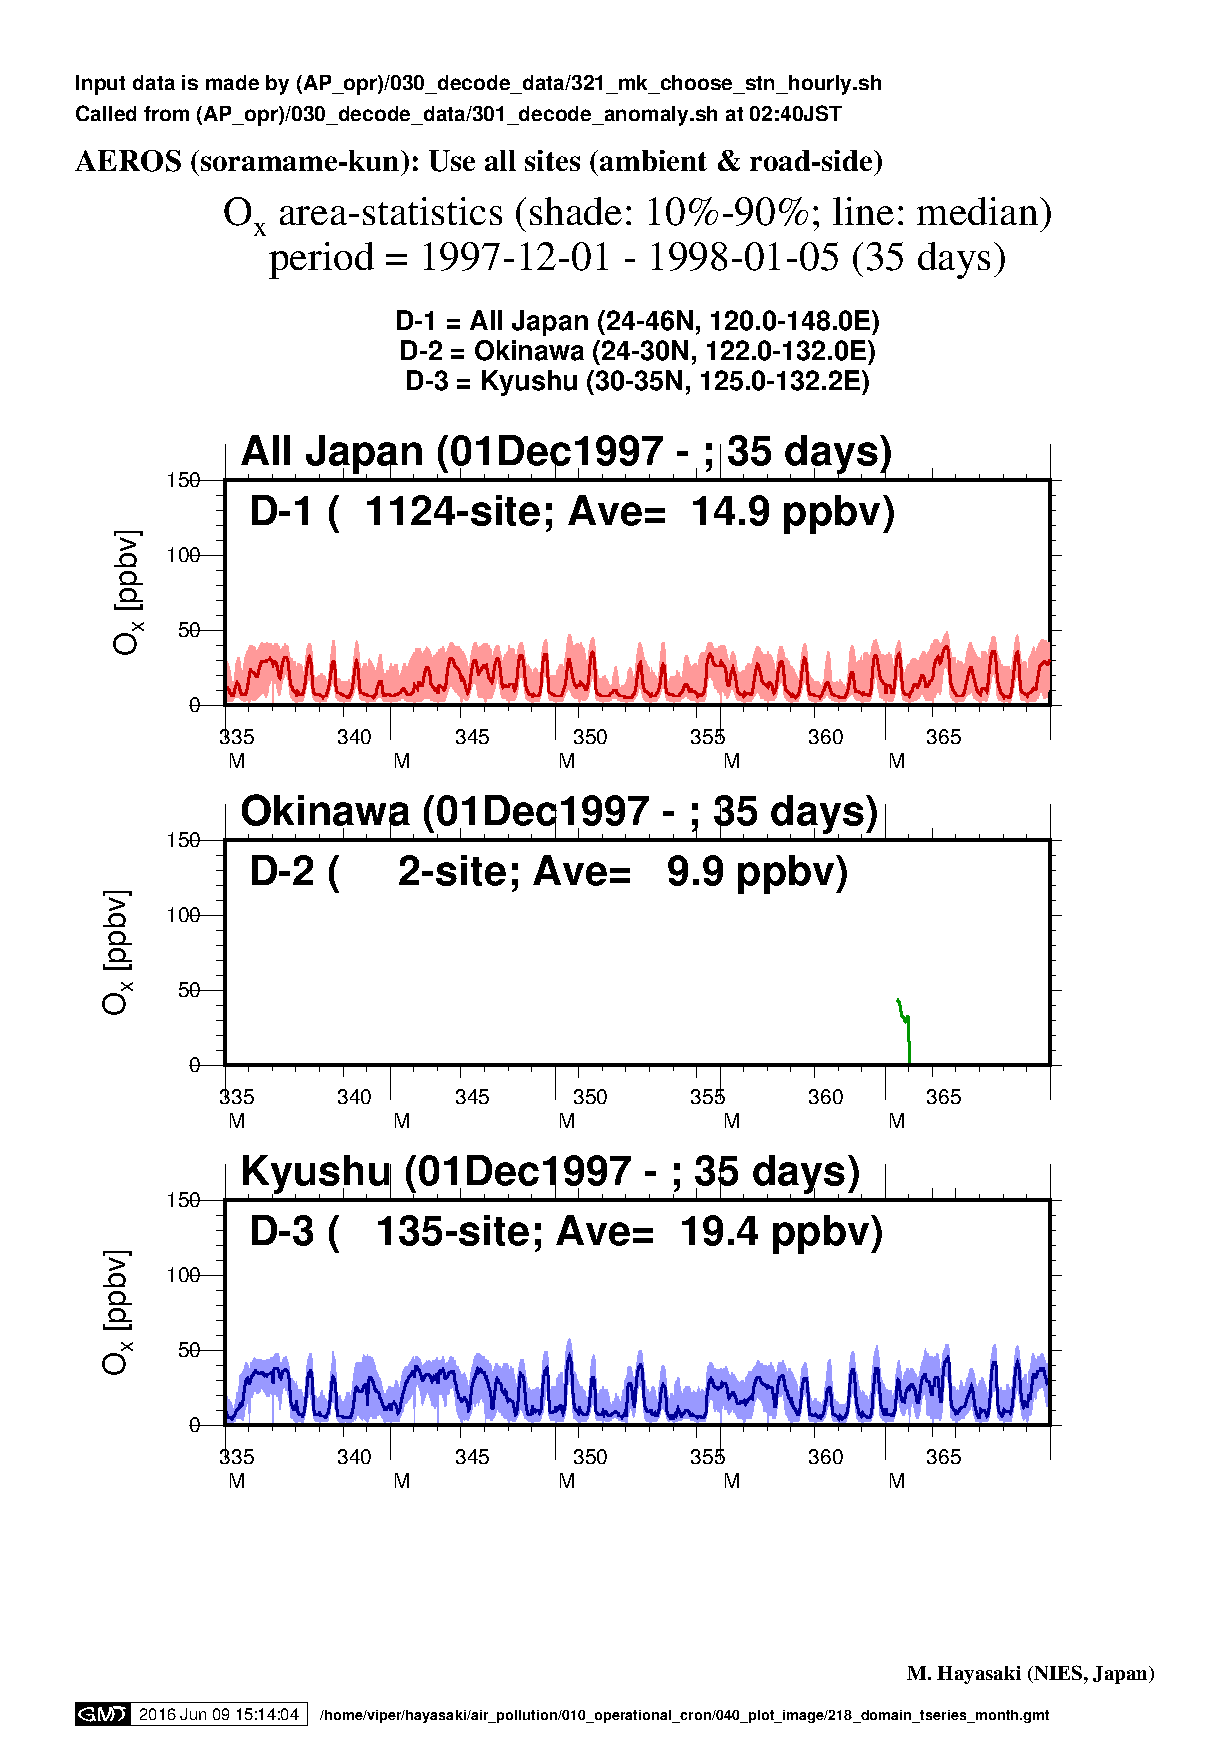
|
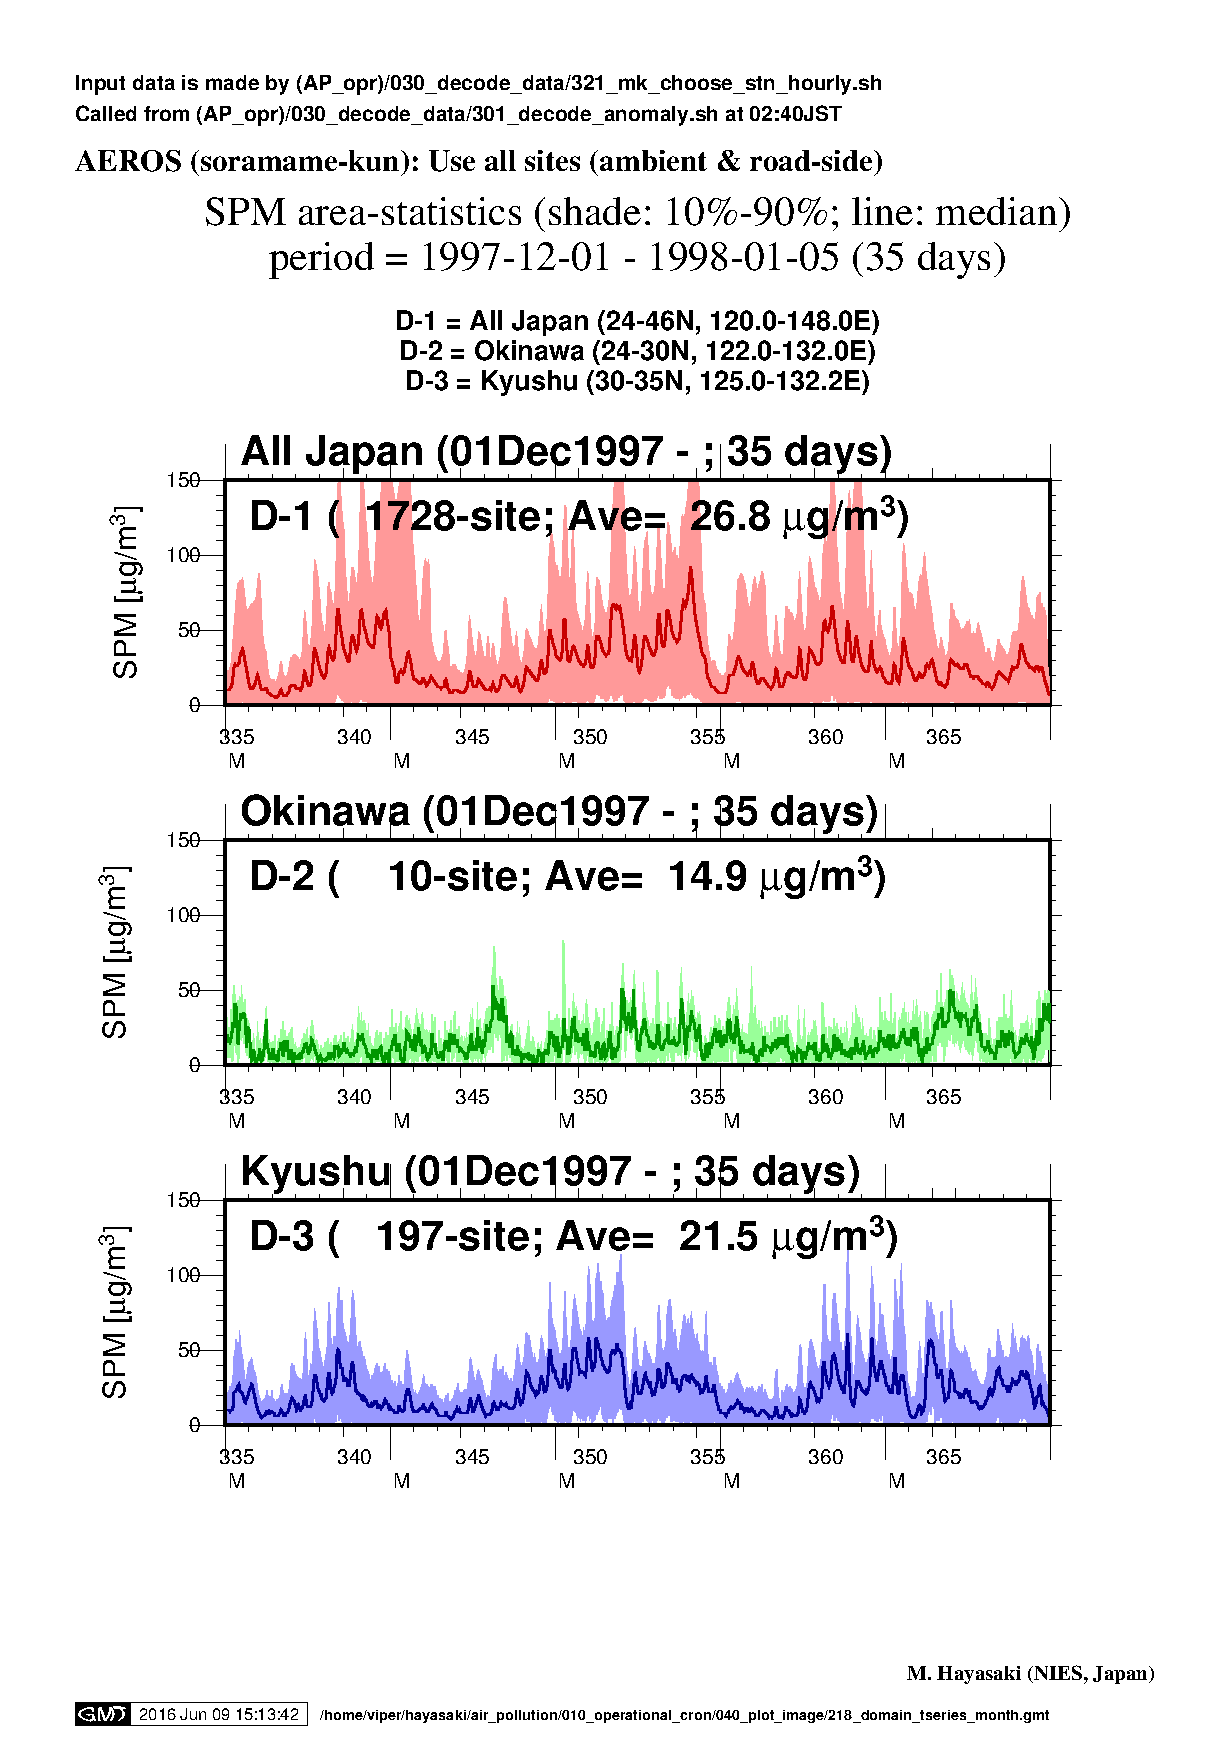
|
NA |
|
| Month | Ox | SPM | PM2.5 | NOx |
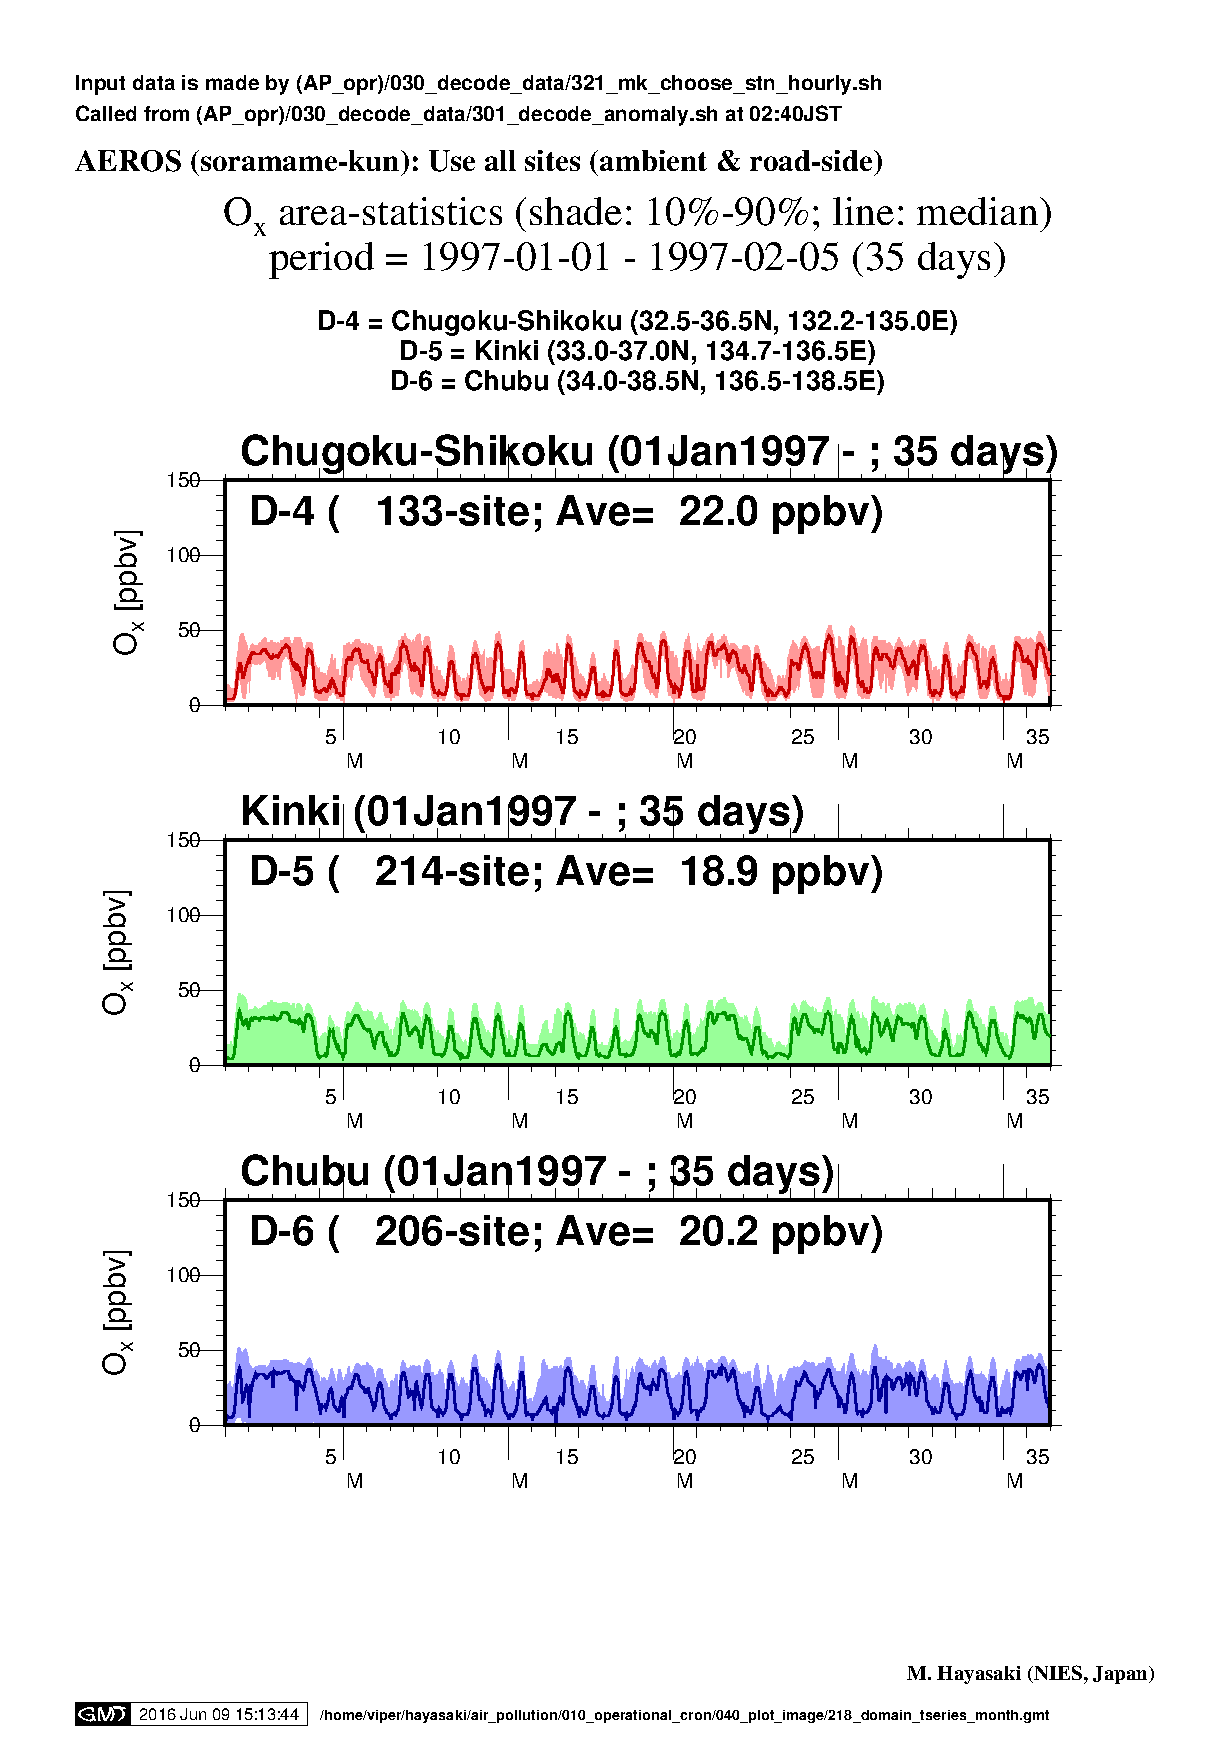
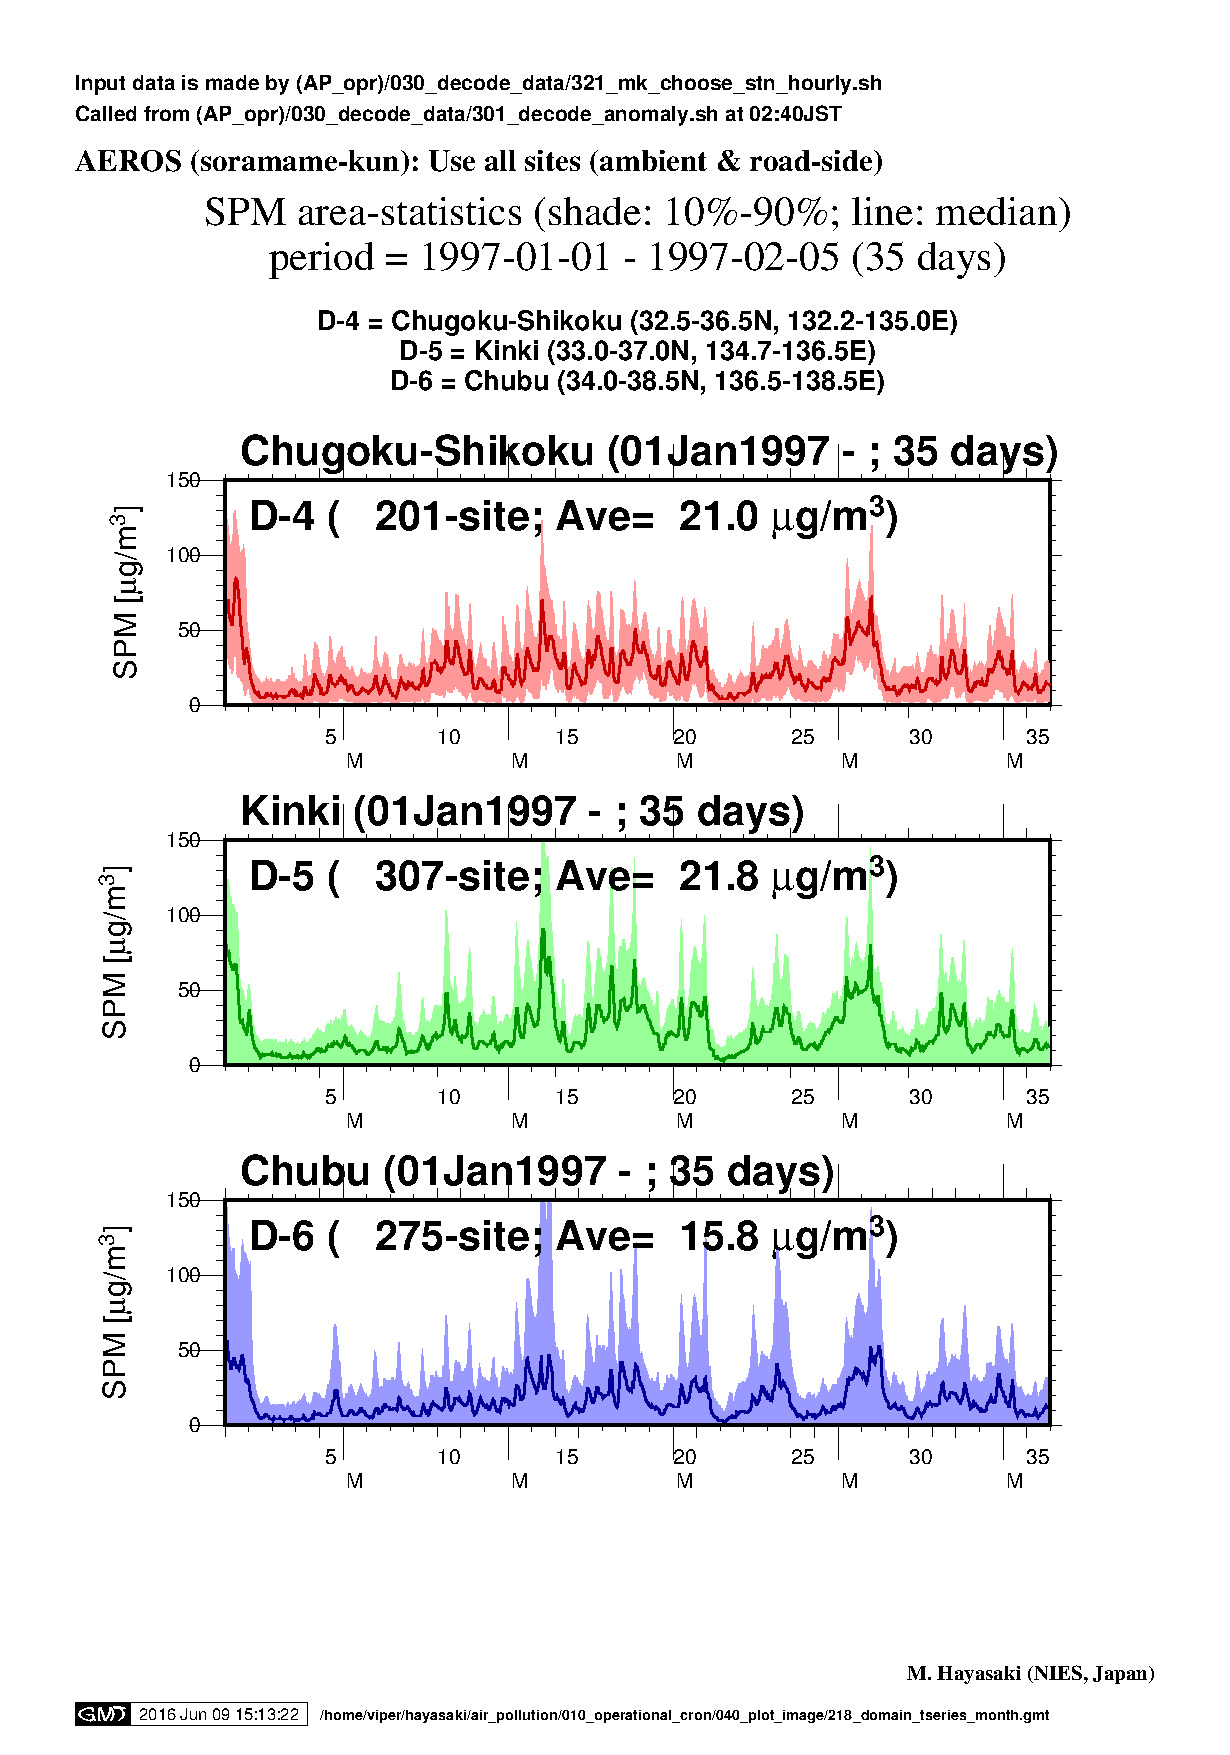
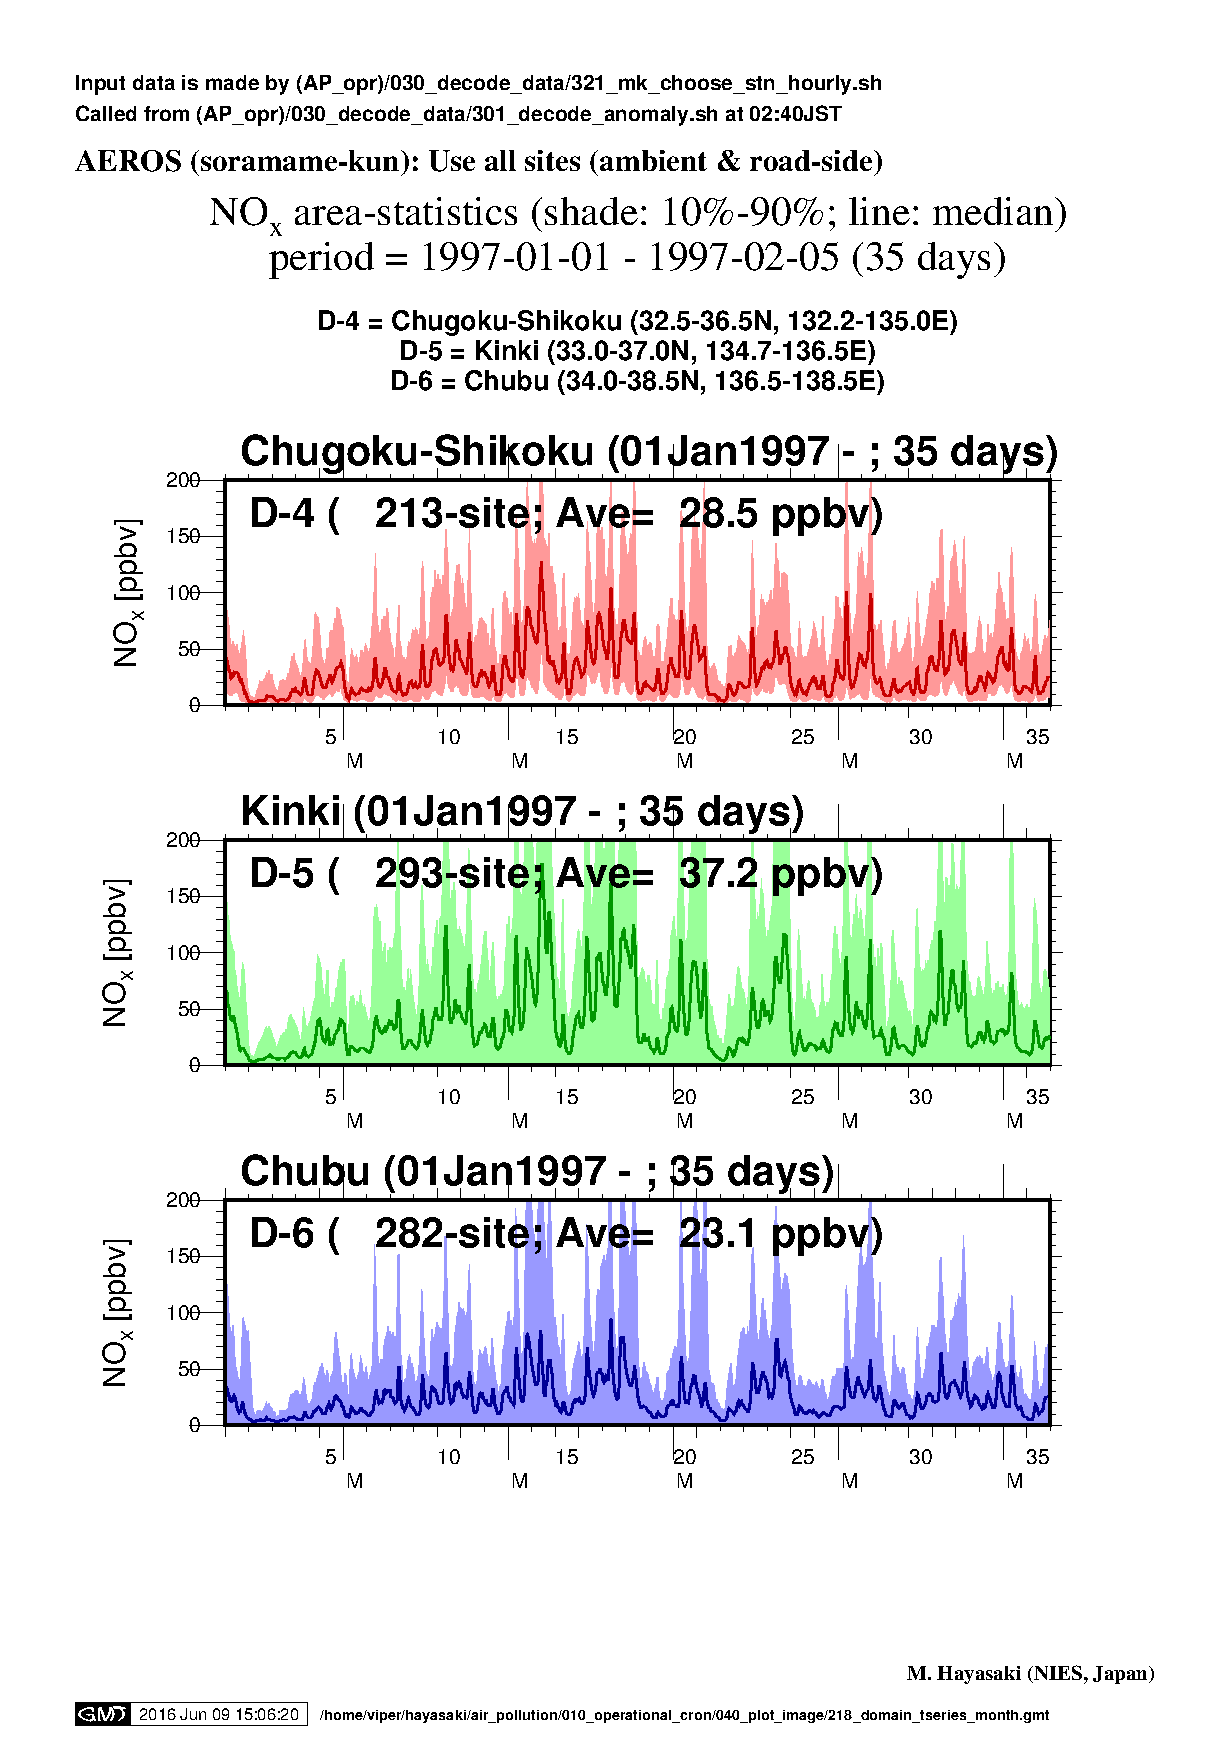
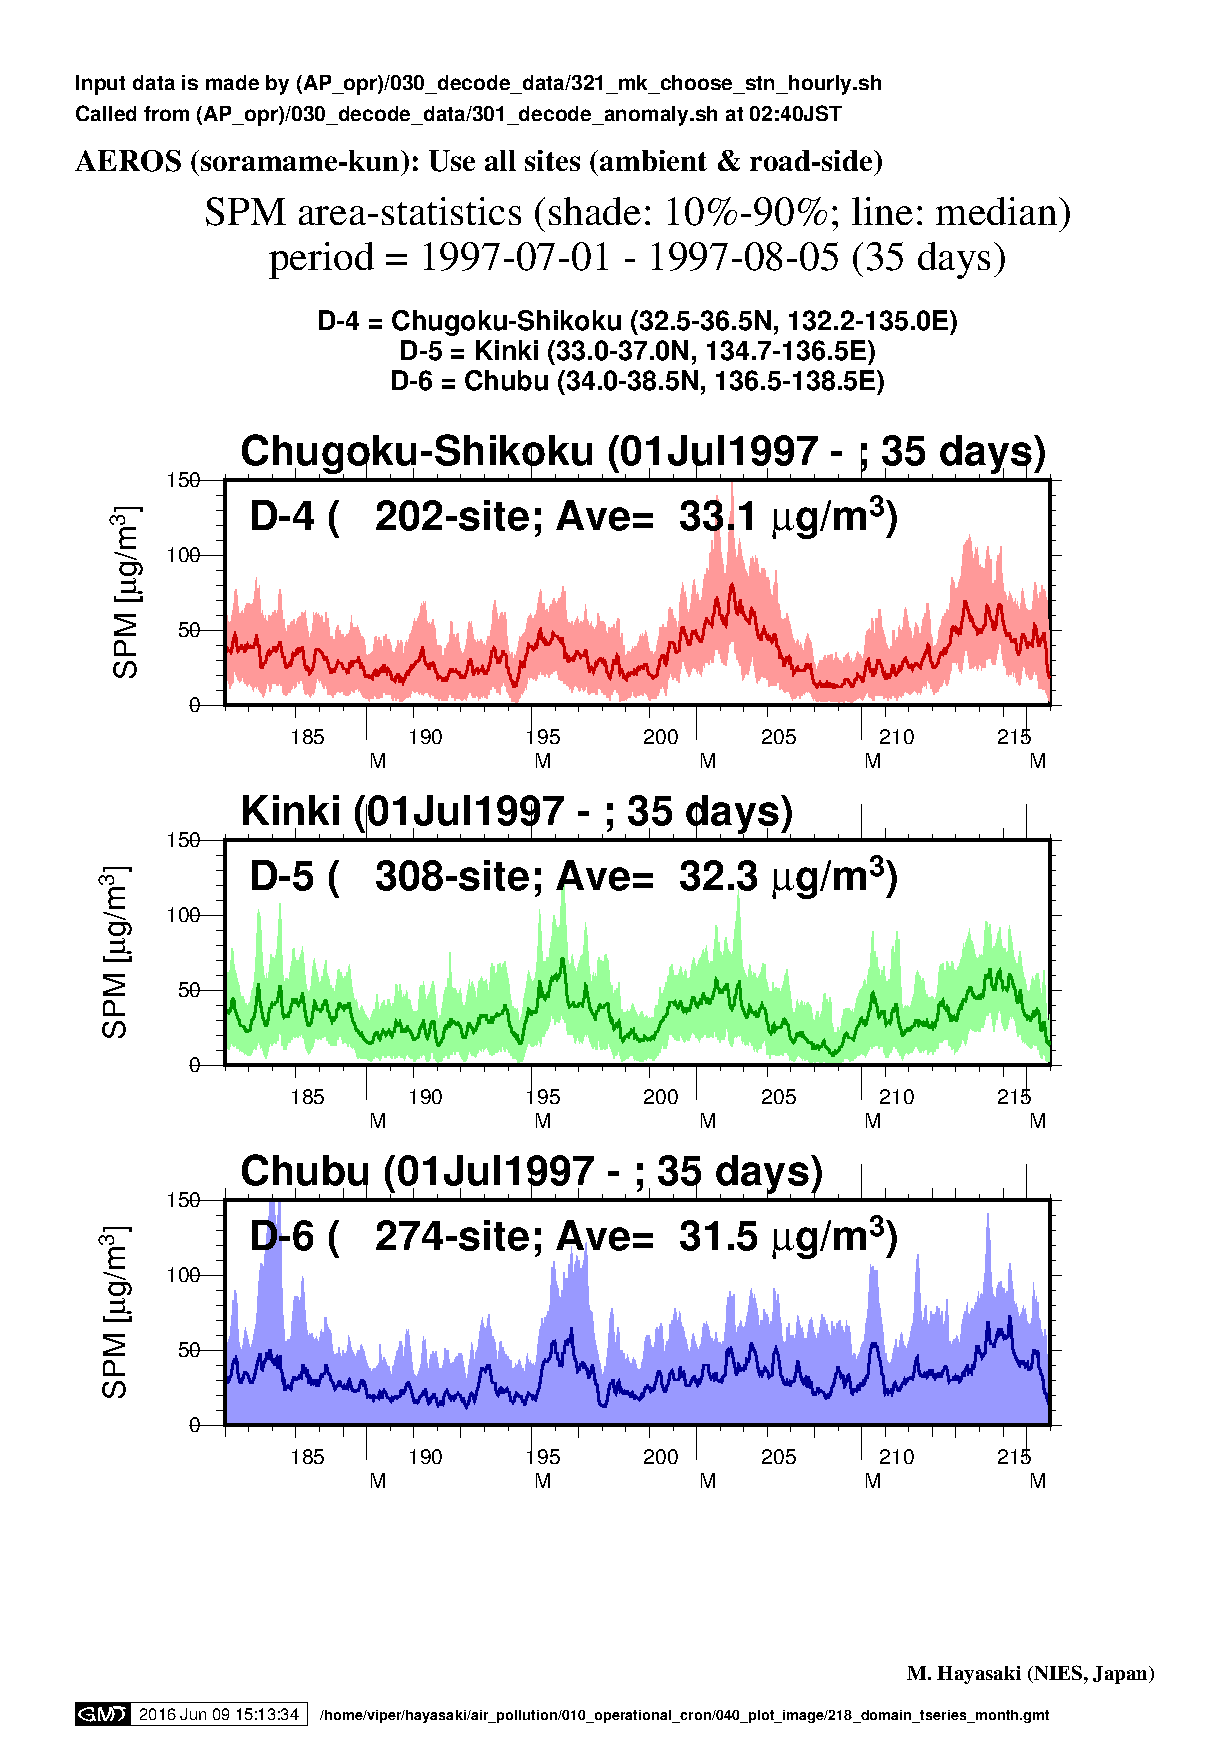
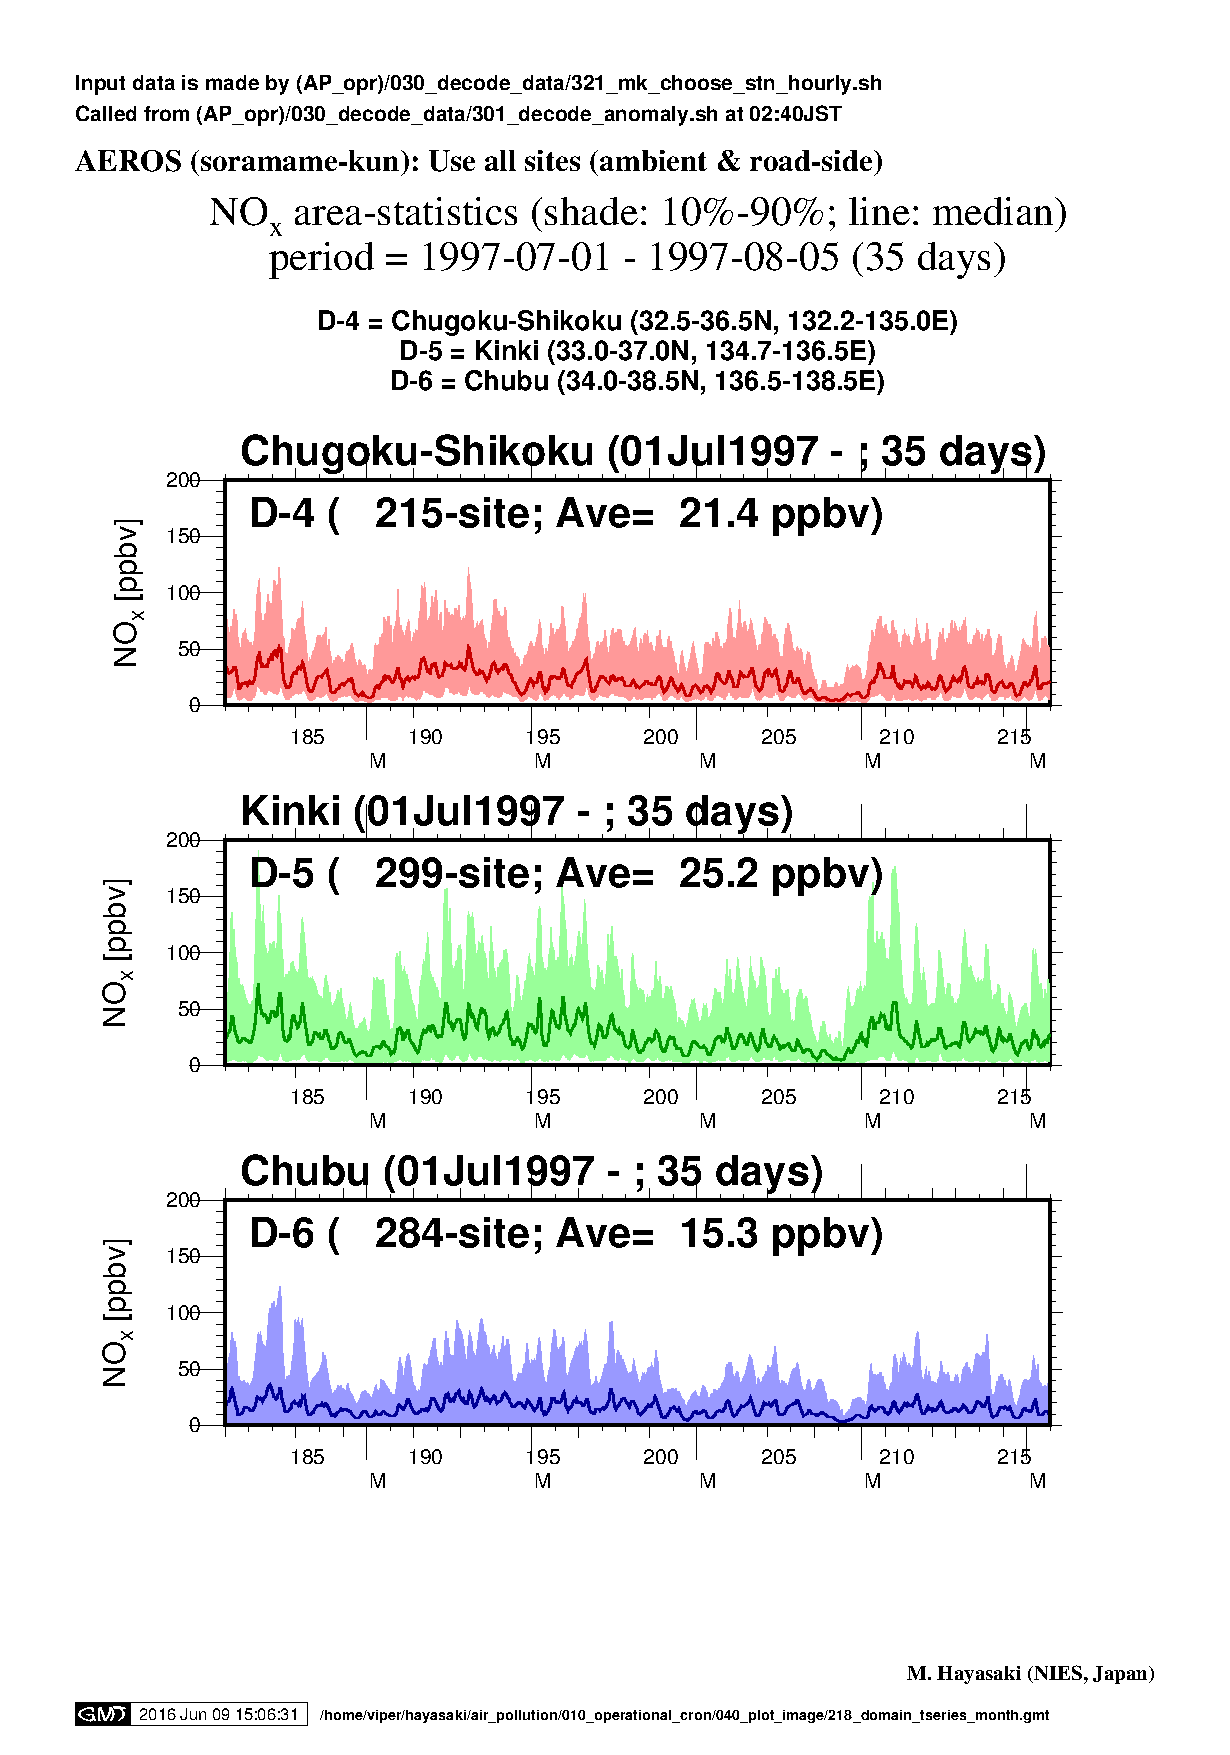
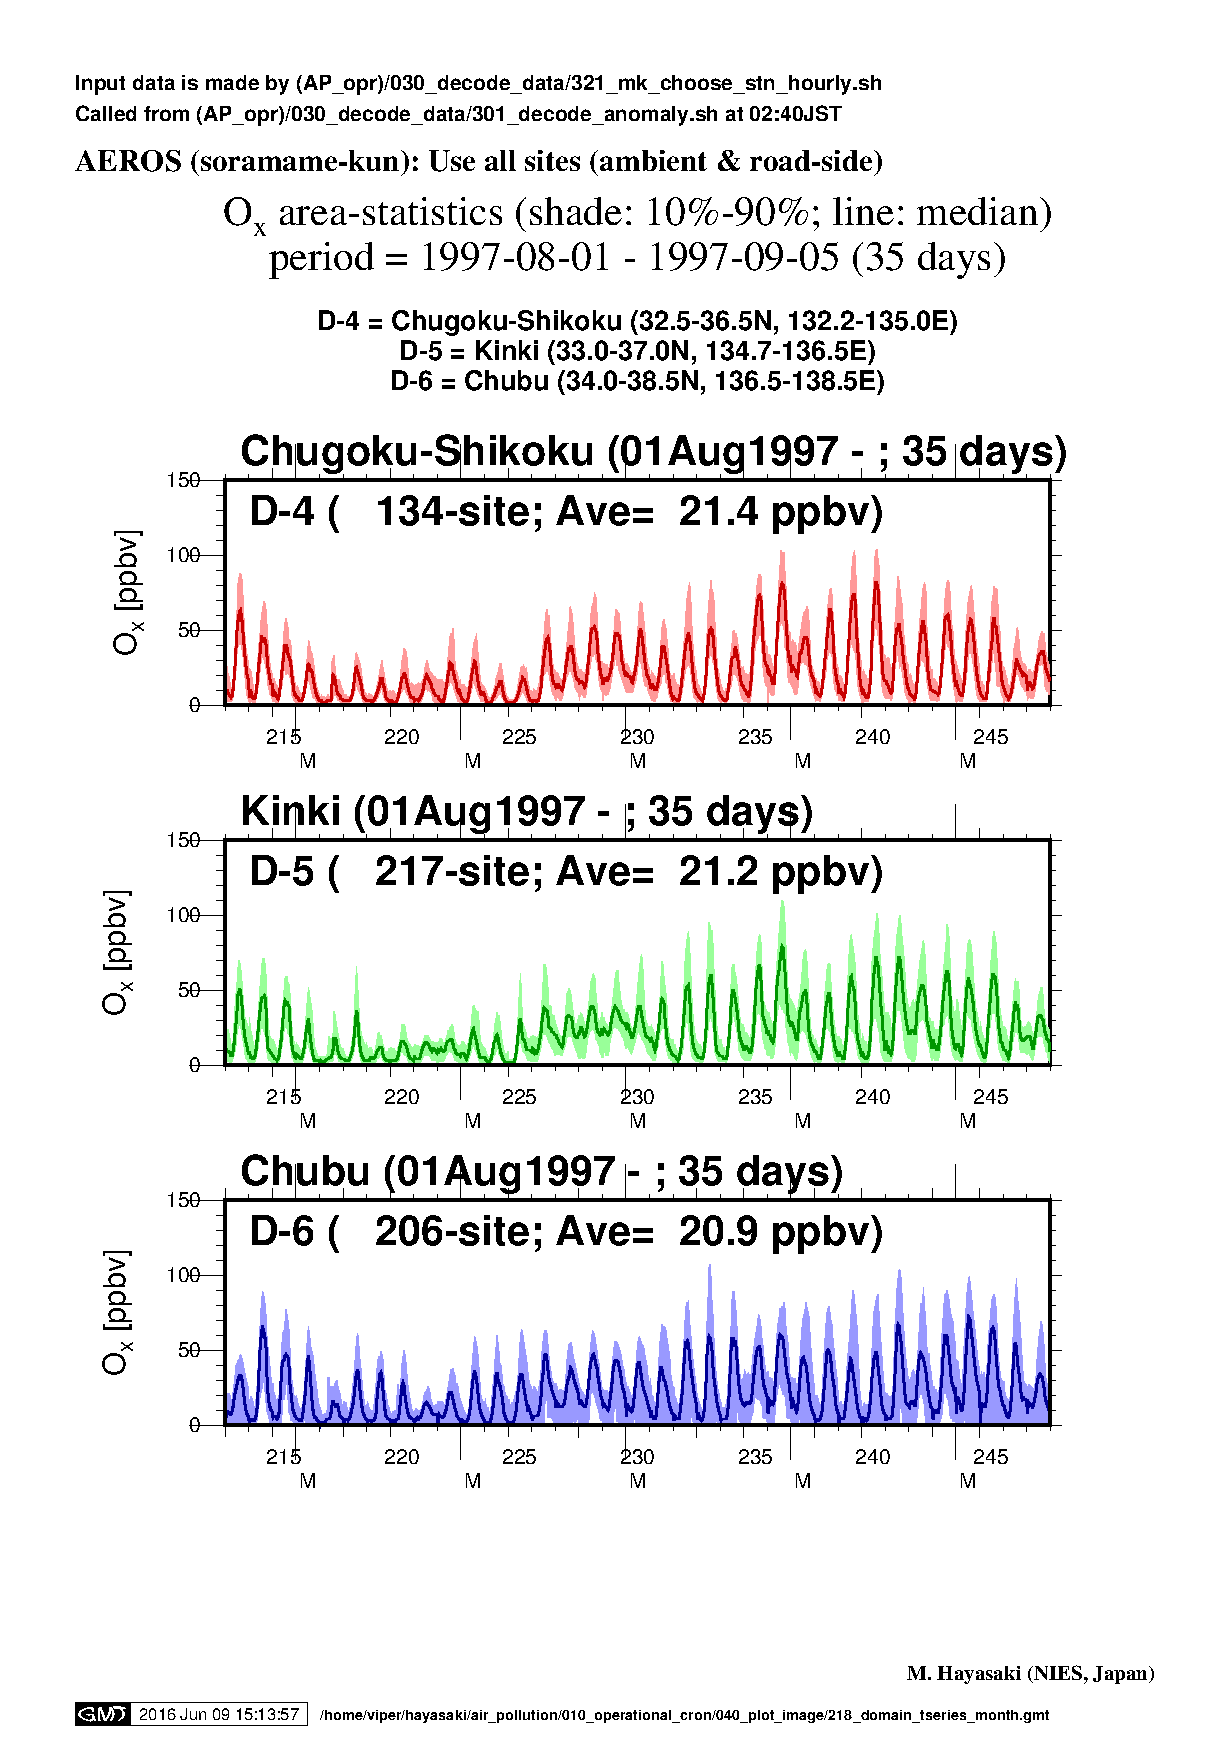
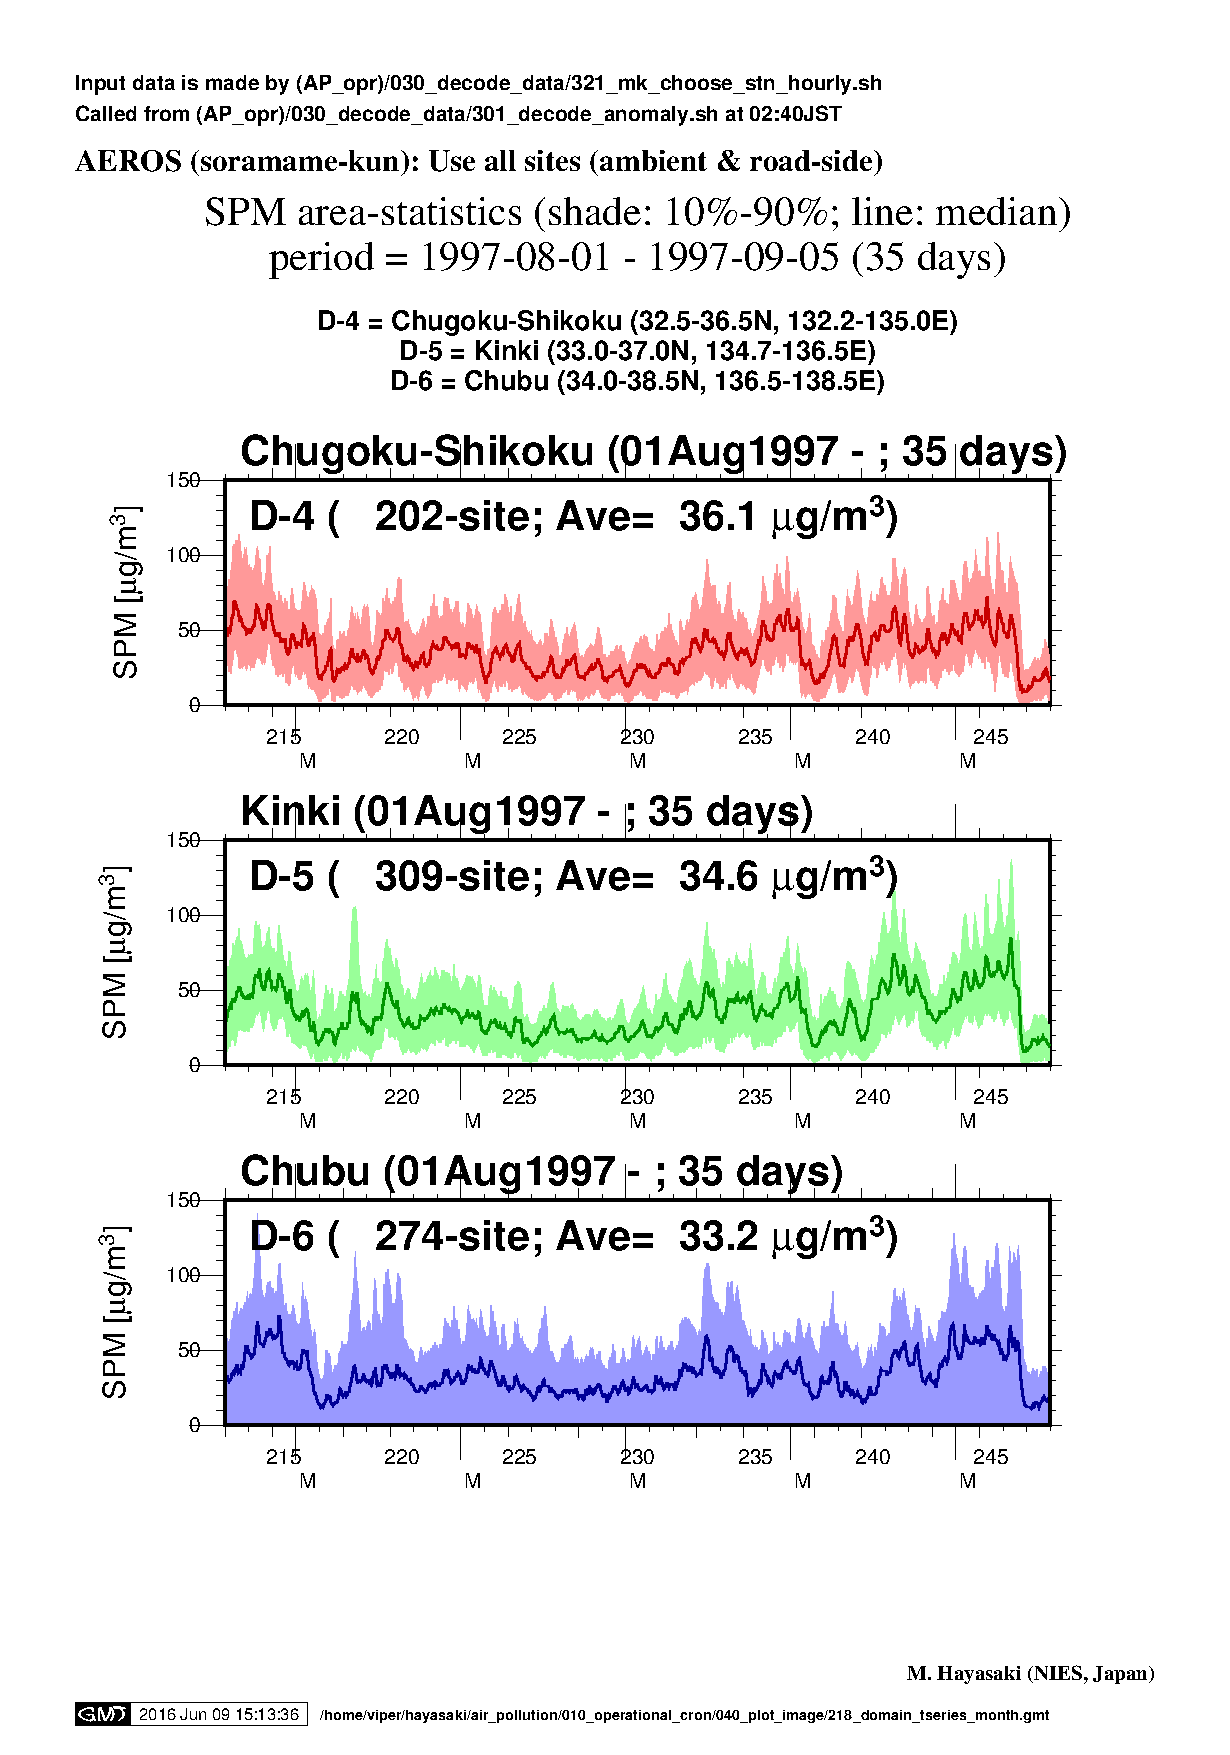
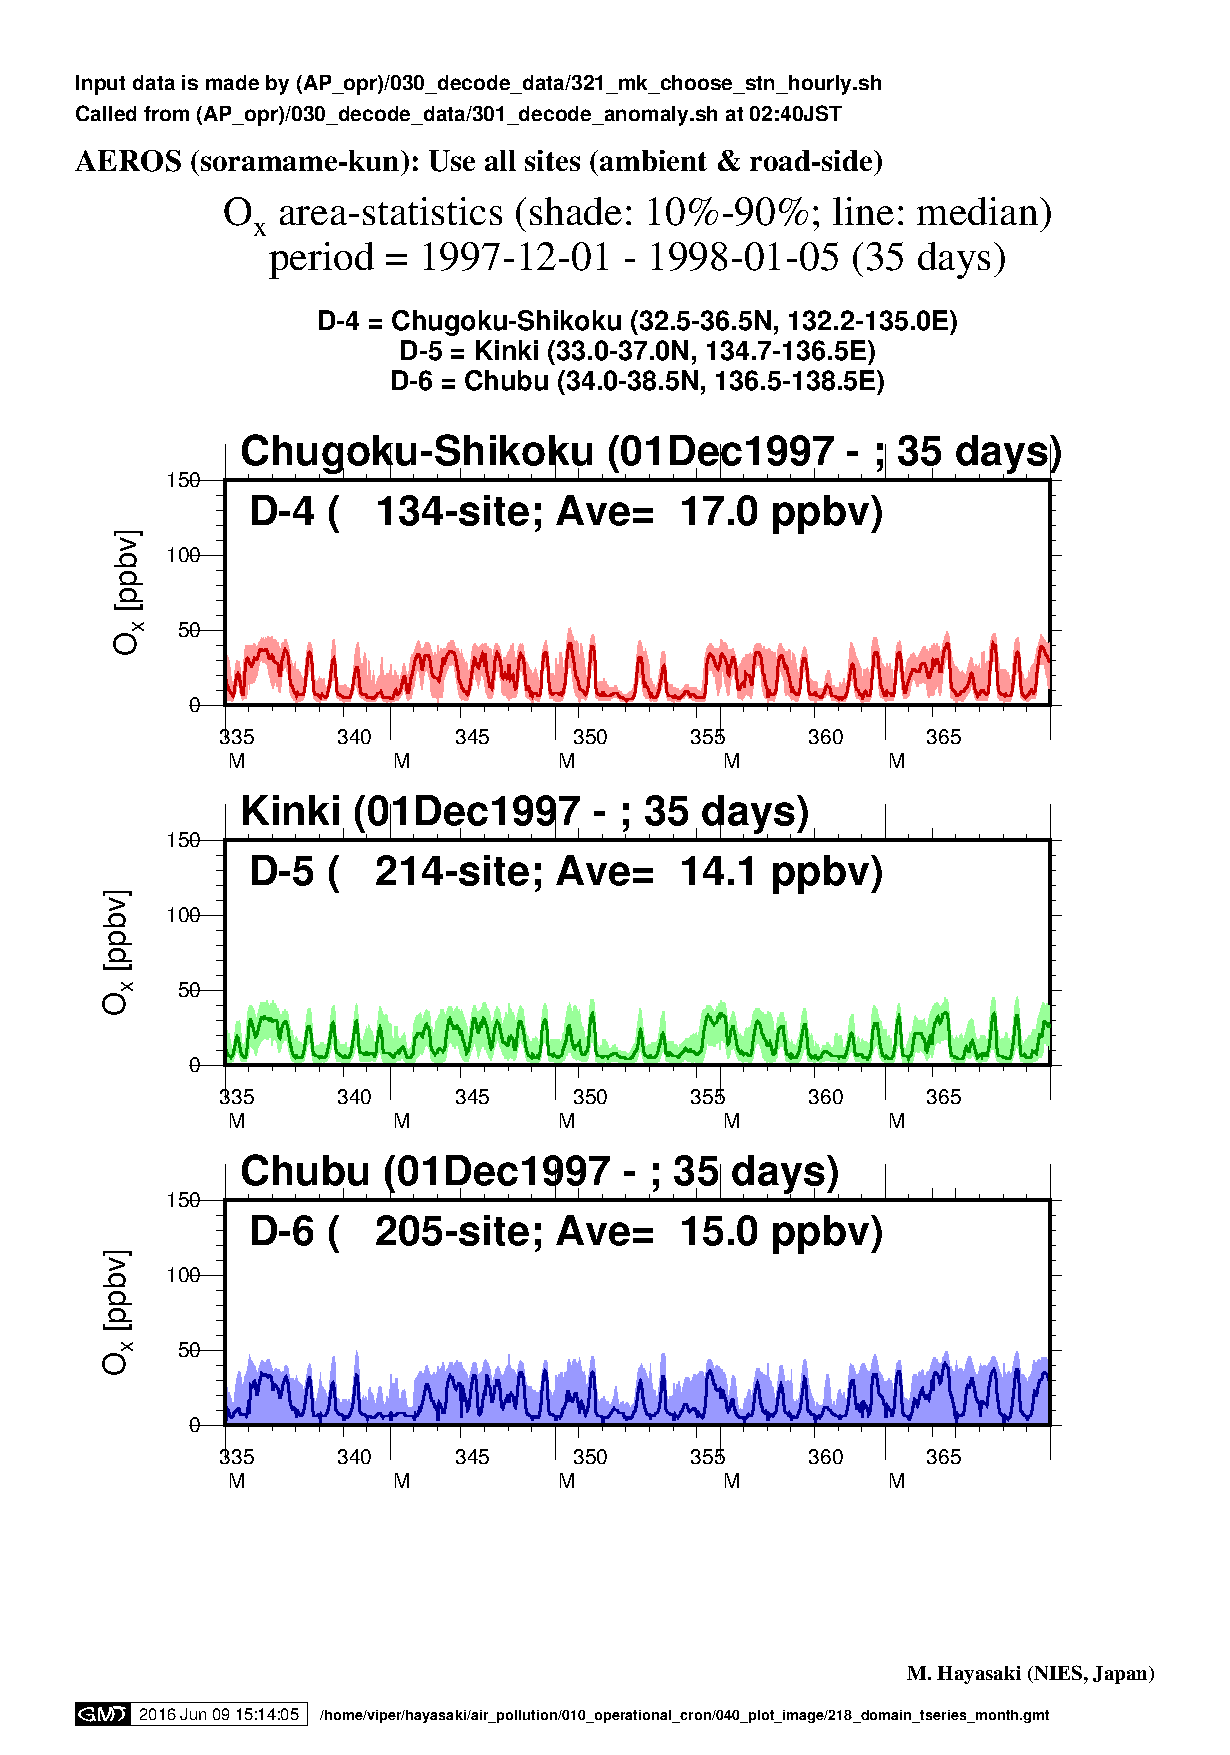
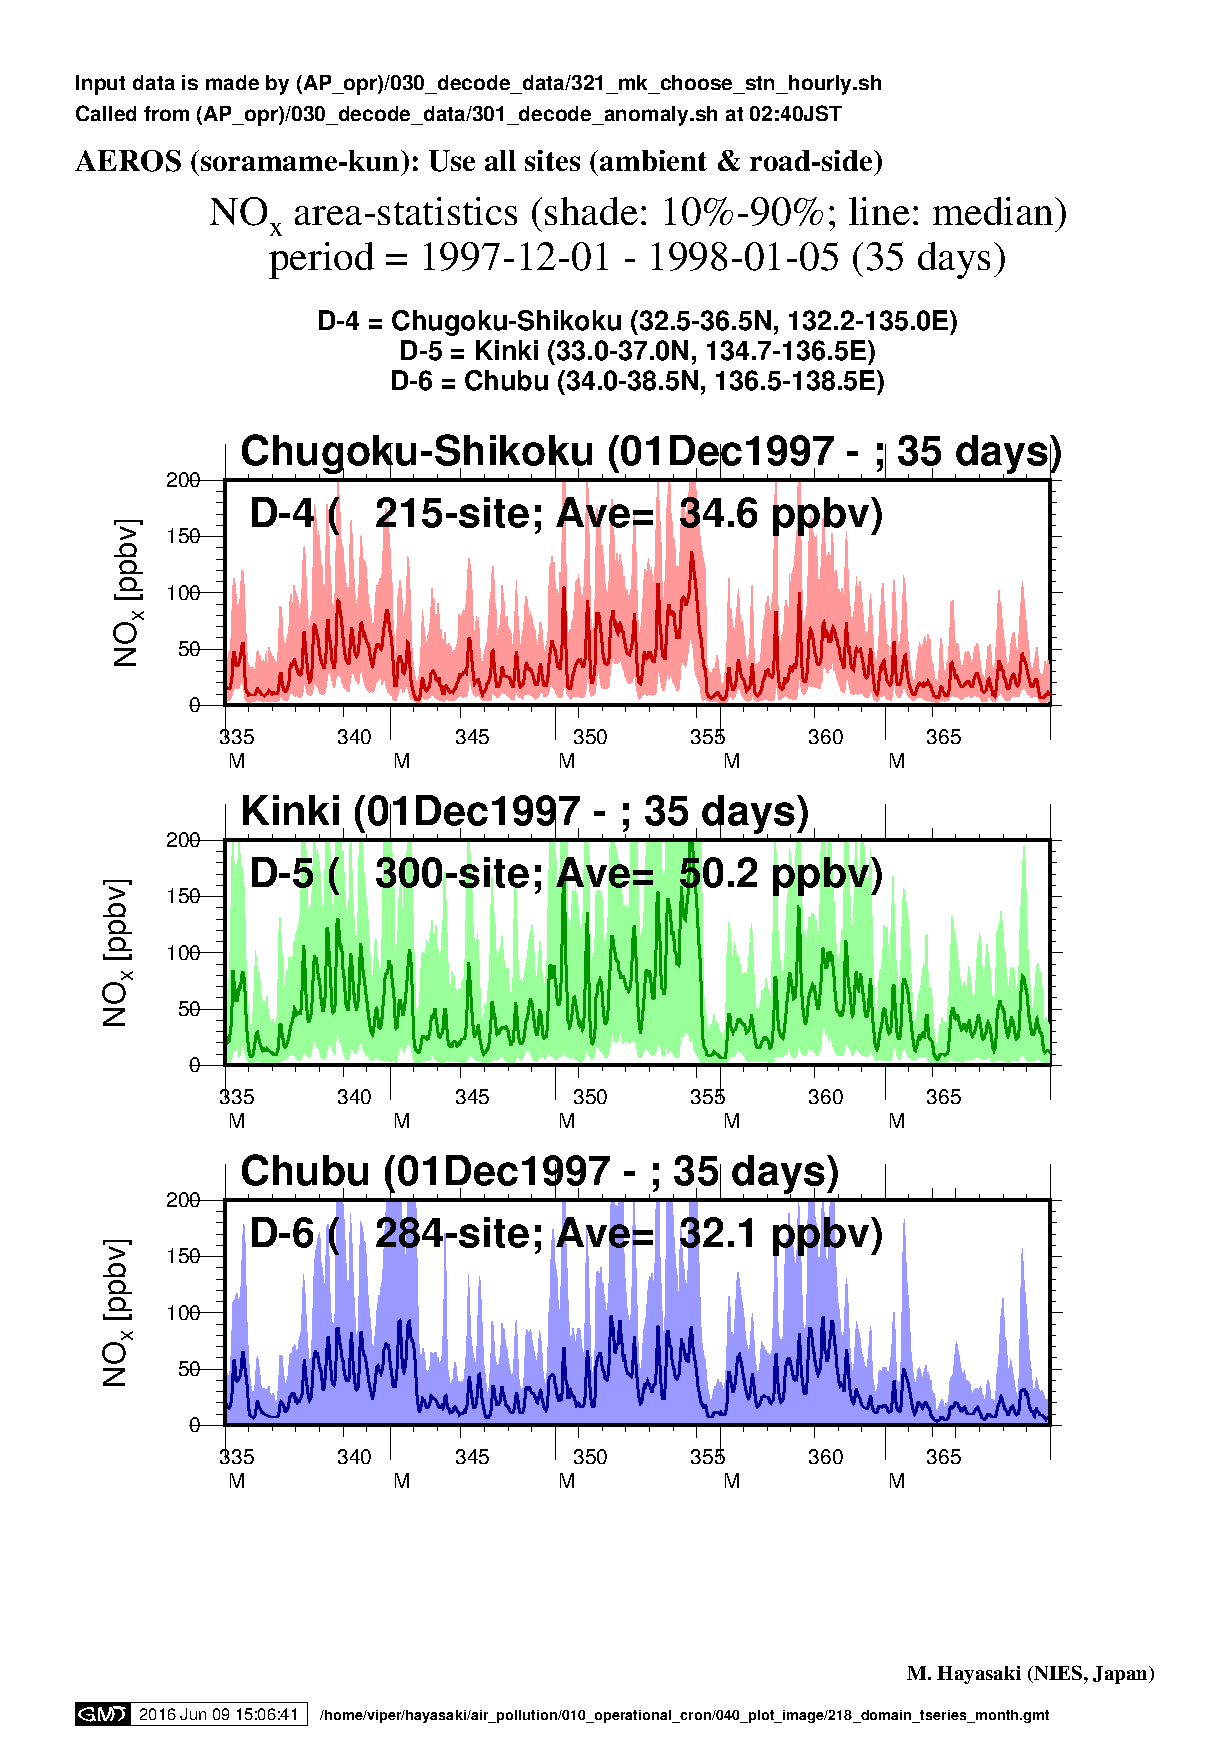
y1997: 中四国,近畿,中部 (領域 4 - 6)
Jan, Feb, Mar, Apr, May, Jun, Jul, Aug, Sep, Oct, Nov, Dec,
| Month | Ox | SPM | PM2.5 | NOx |
|---|---|---|---|---|
| Jan1997 (D4 - 6) |
|
|
NA |
|
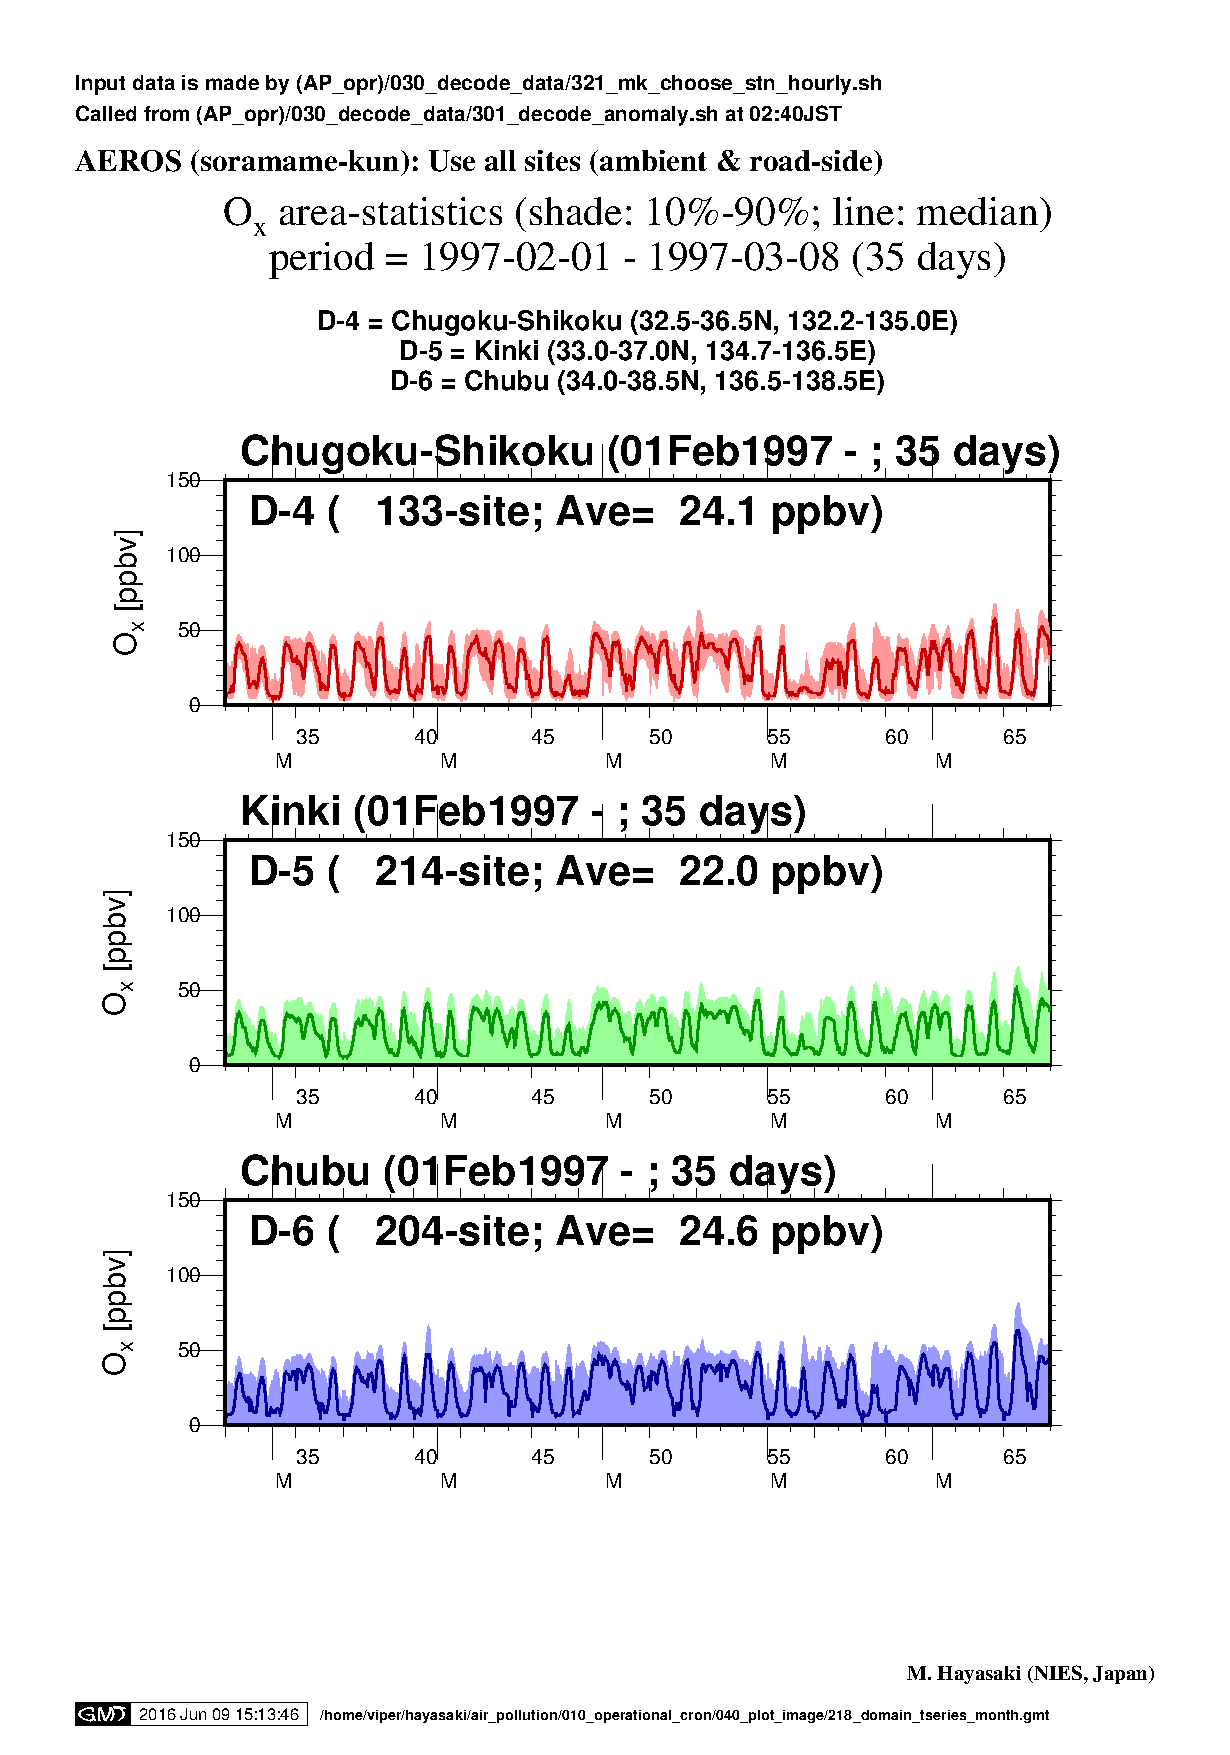
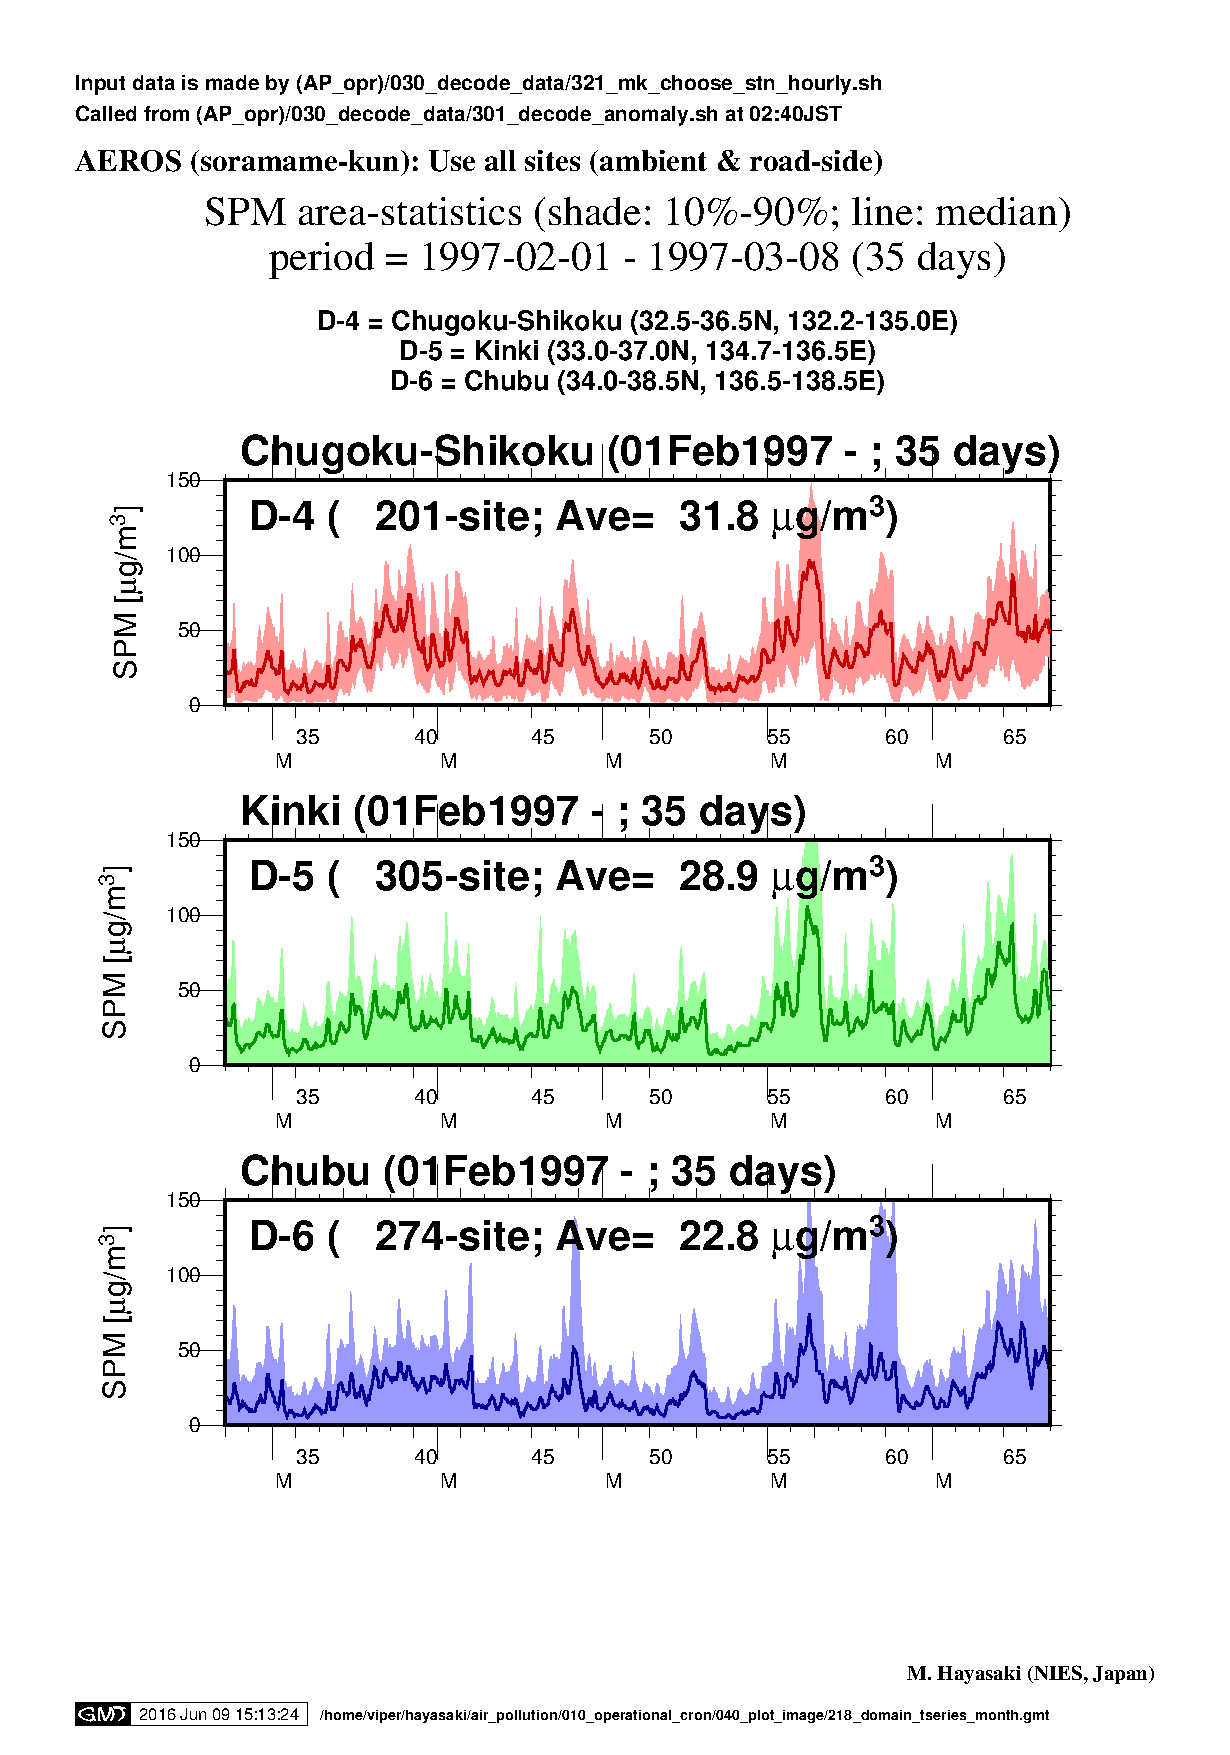
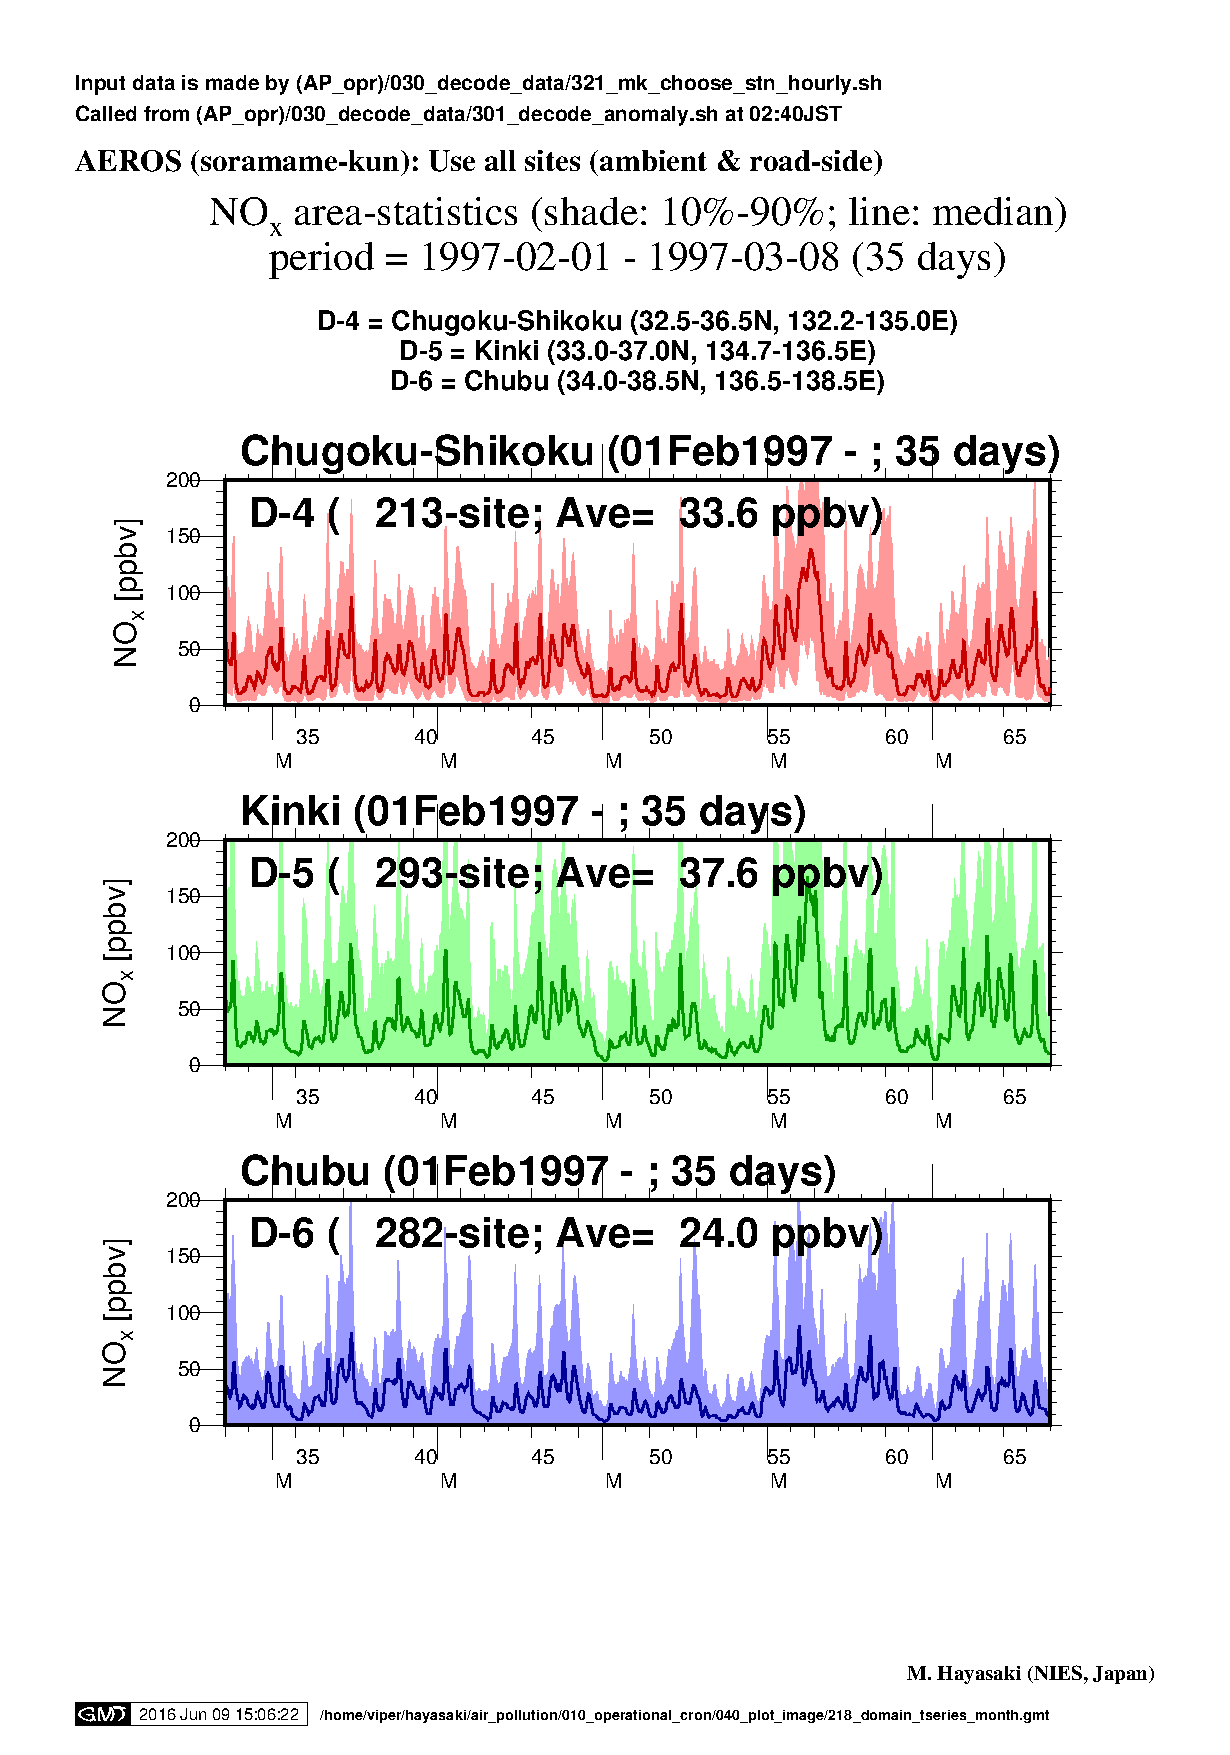
| Feb1997 (D4 - 6) |
|
|
NA |
|
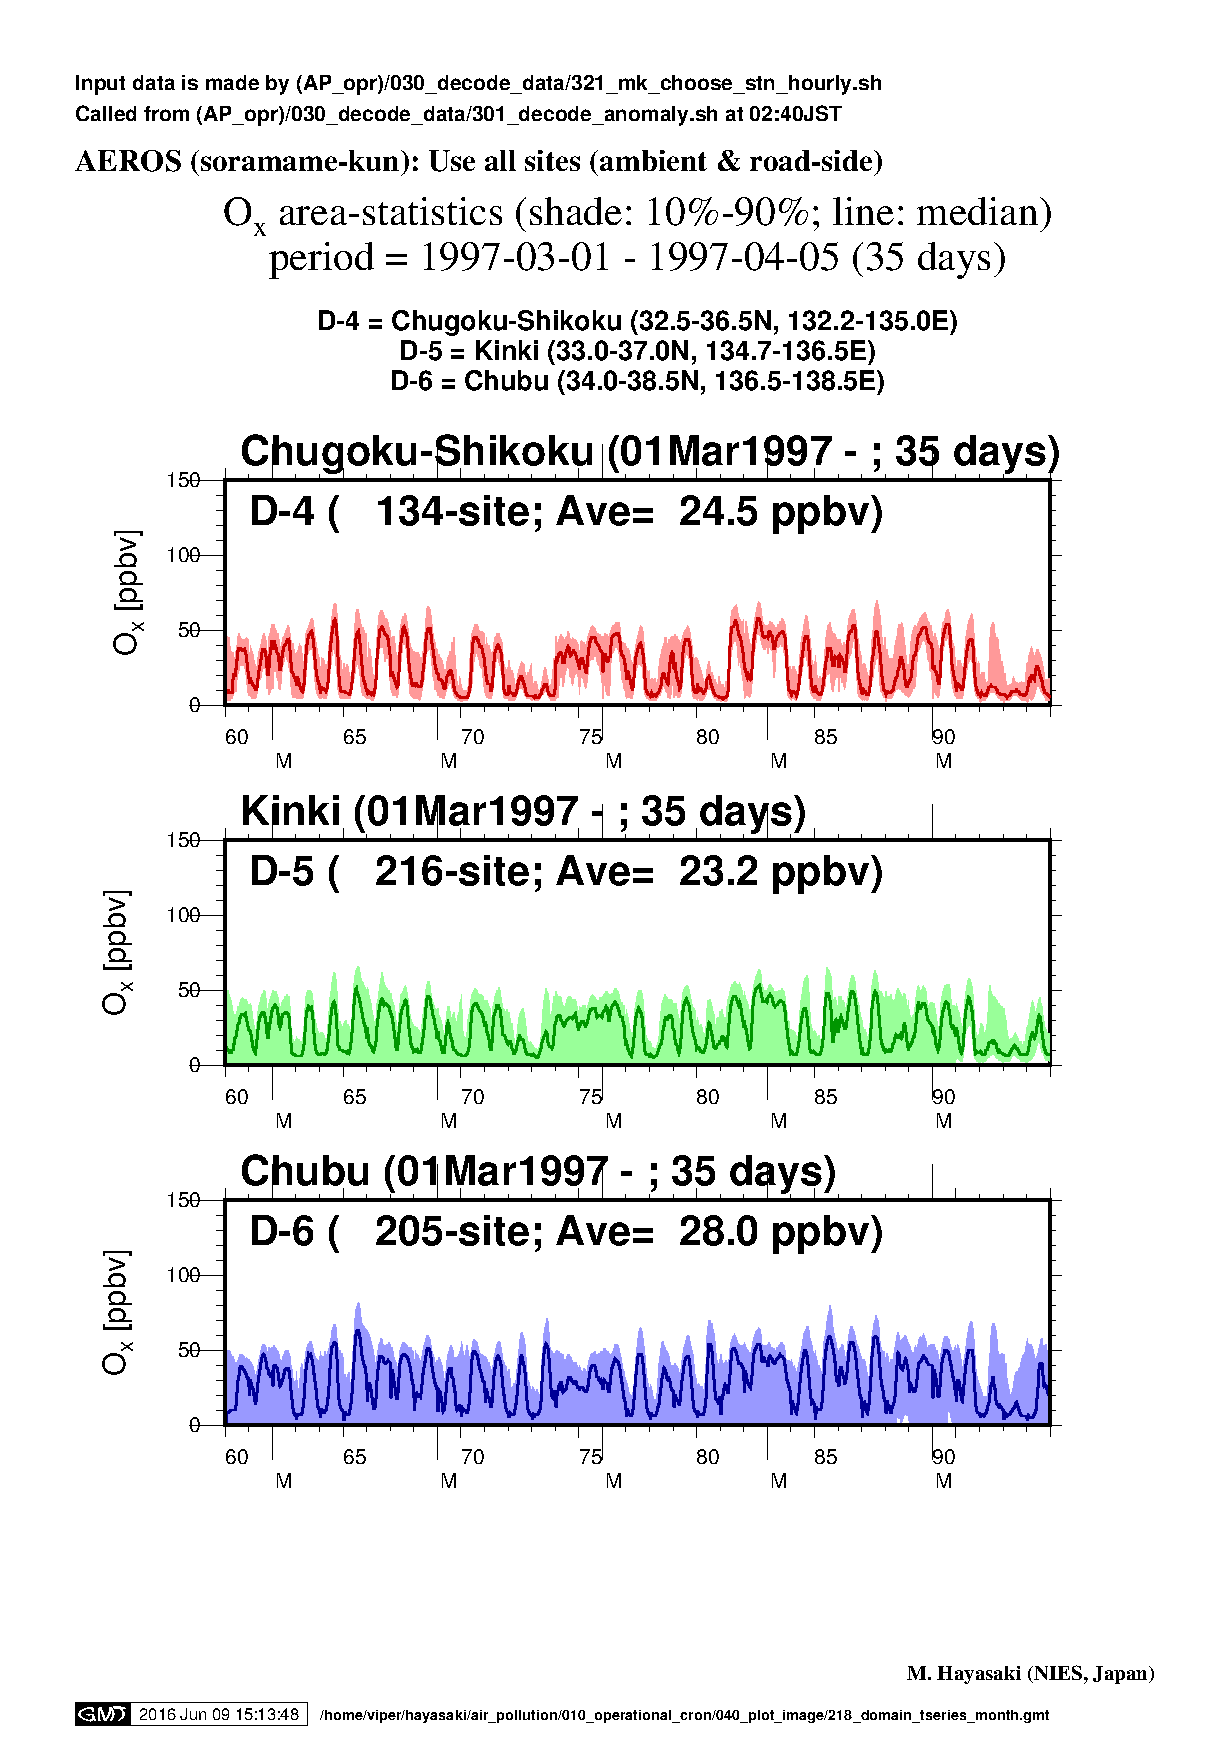
| Mar1997 (D4 - 6) |
|
|
NA |
|
| Month | Ox | SPM | PM2.5 | NOx |
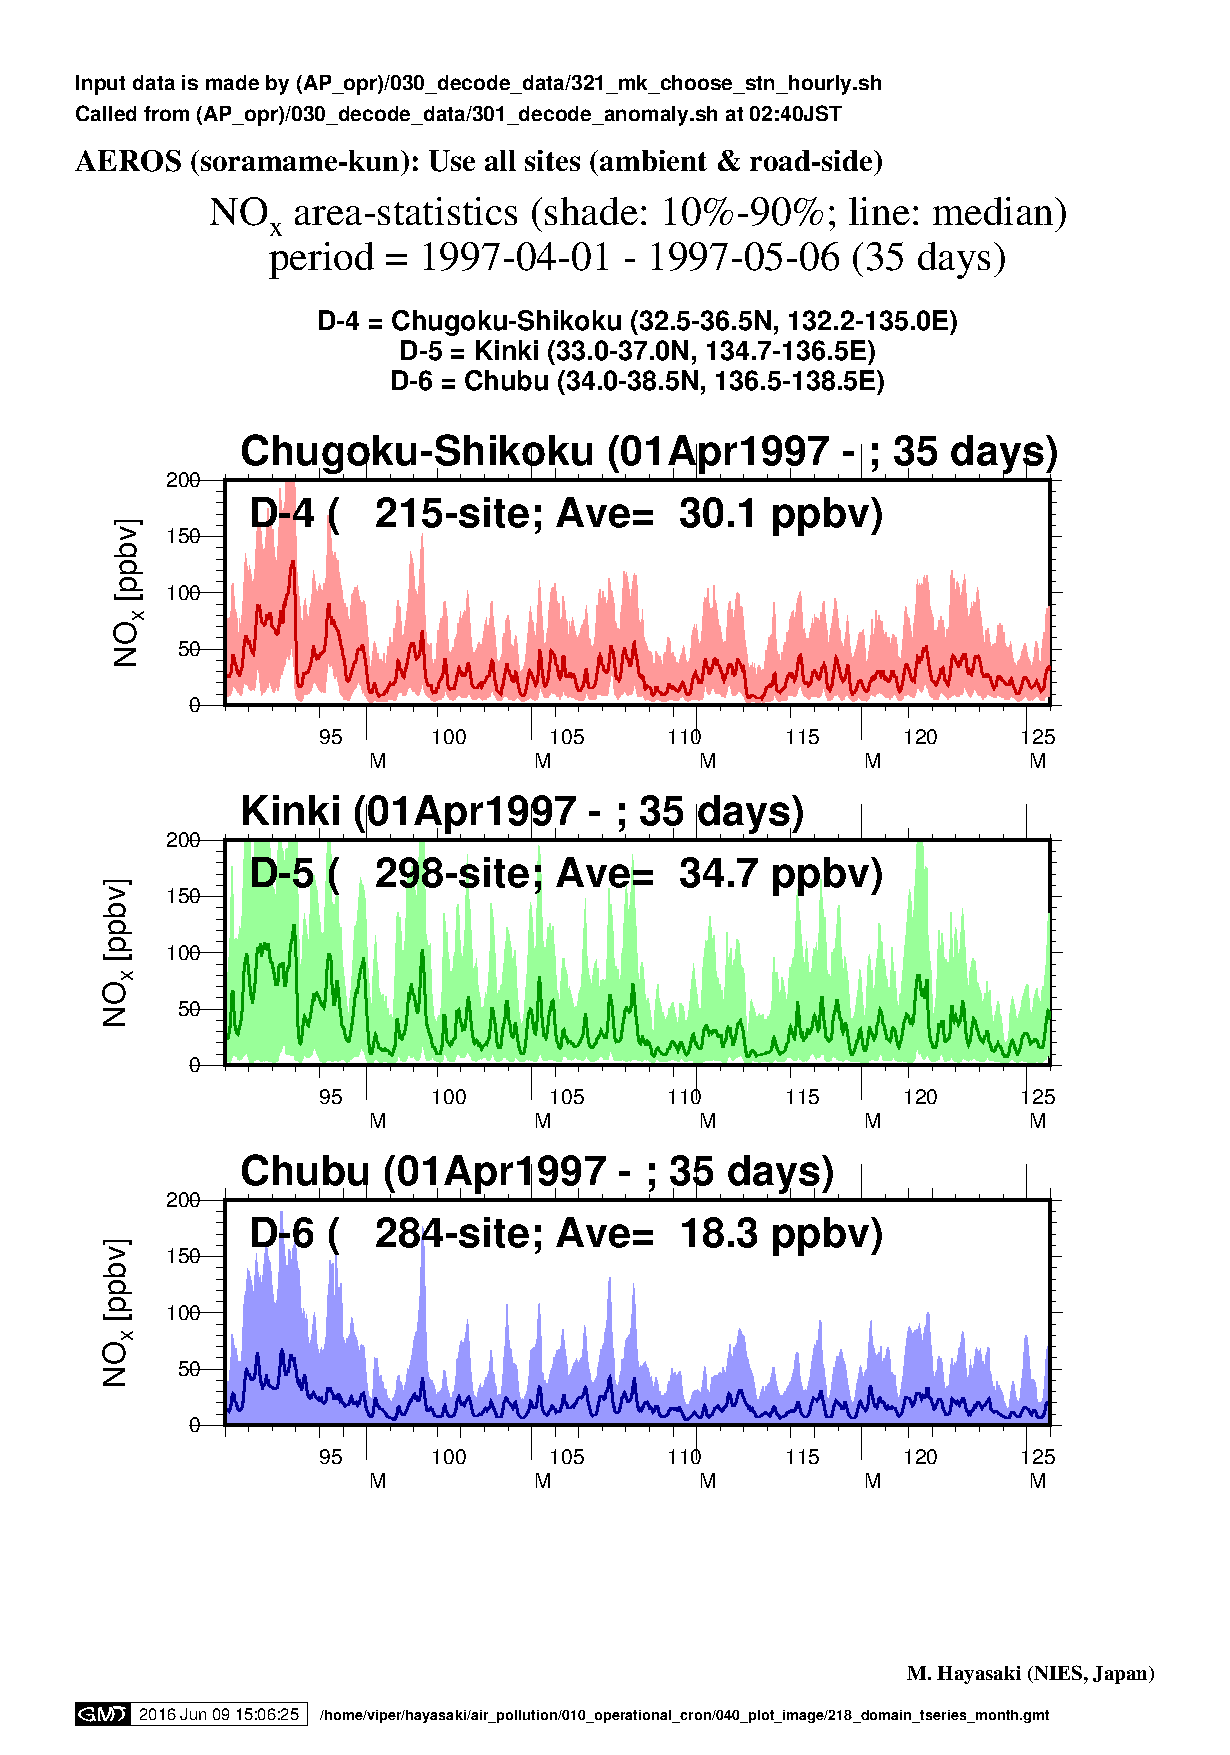
| Apr1997 (D4 - 6) |
|
|
NA |
|
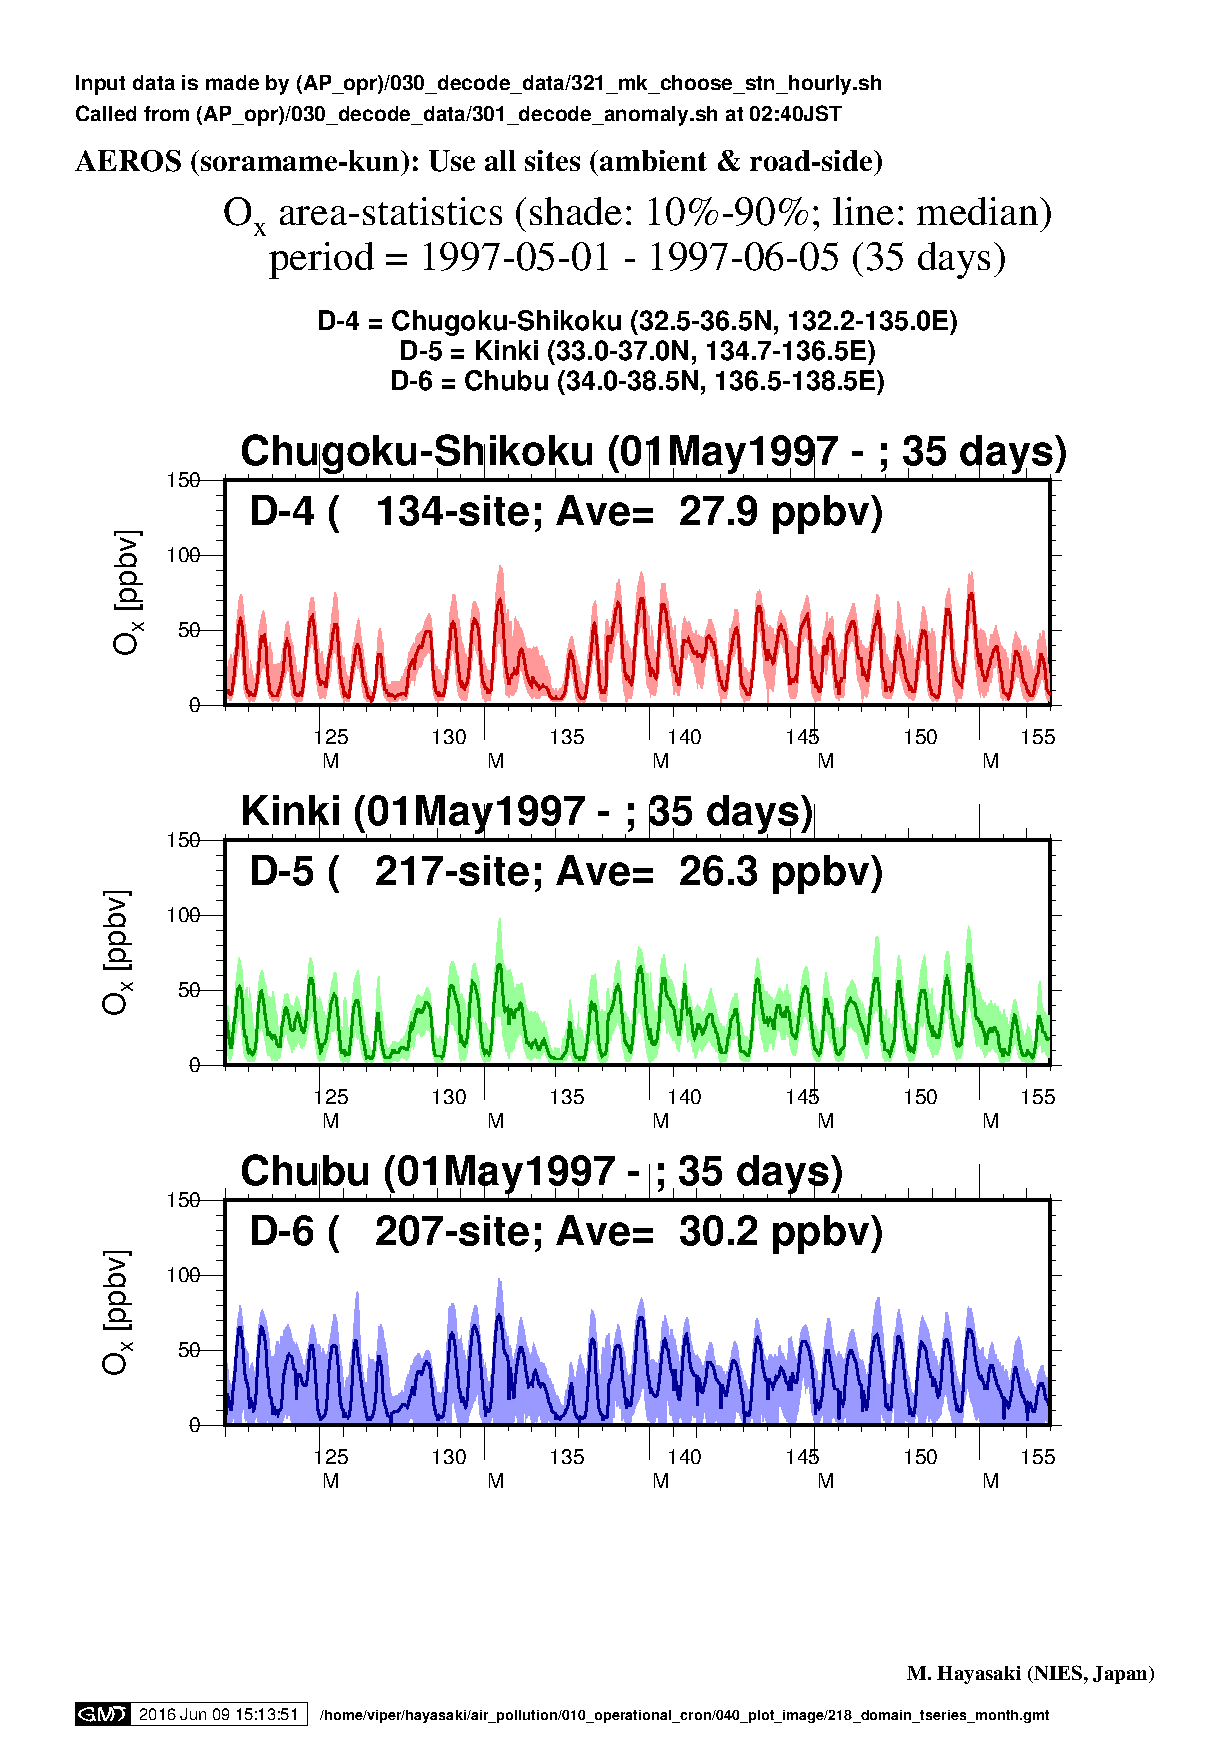
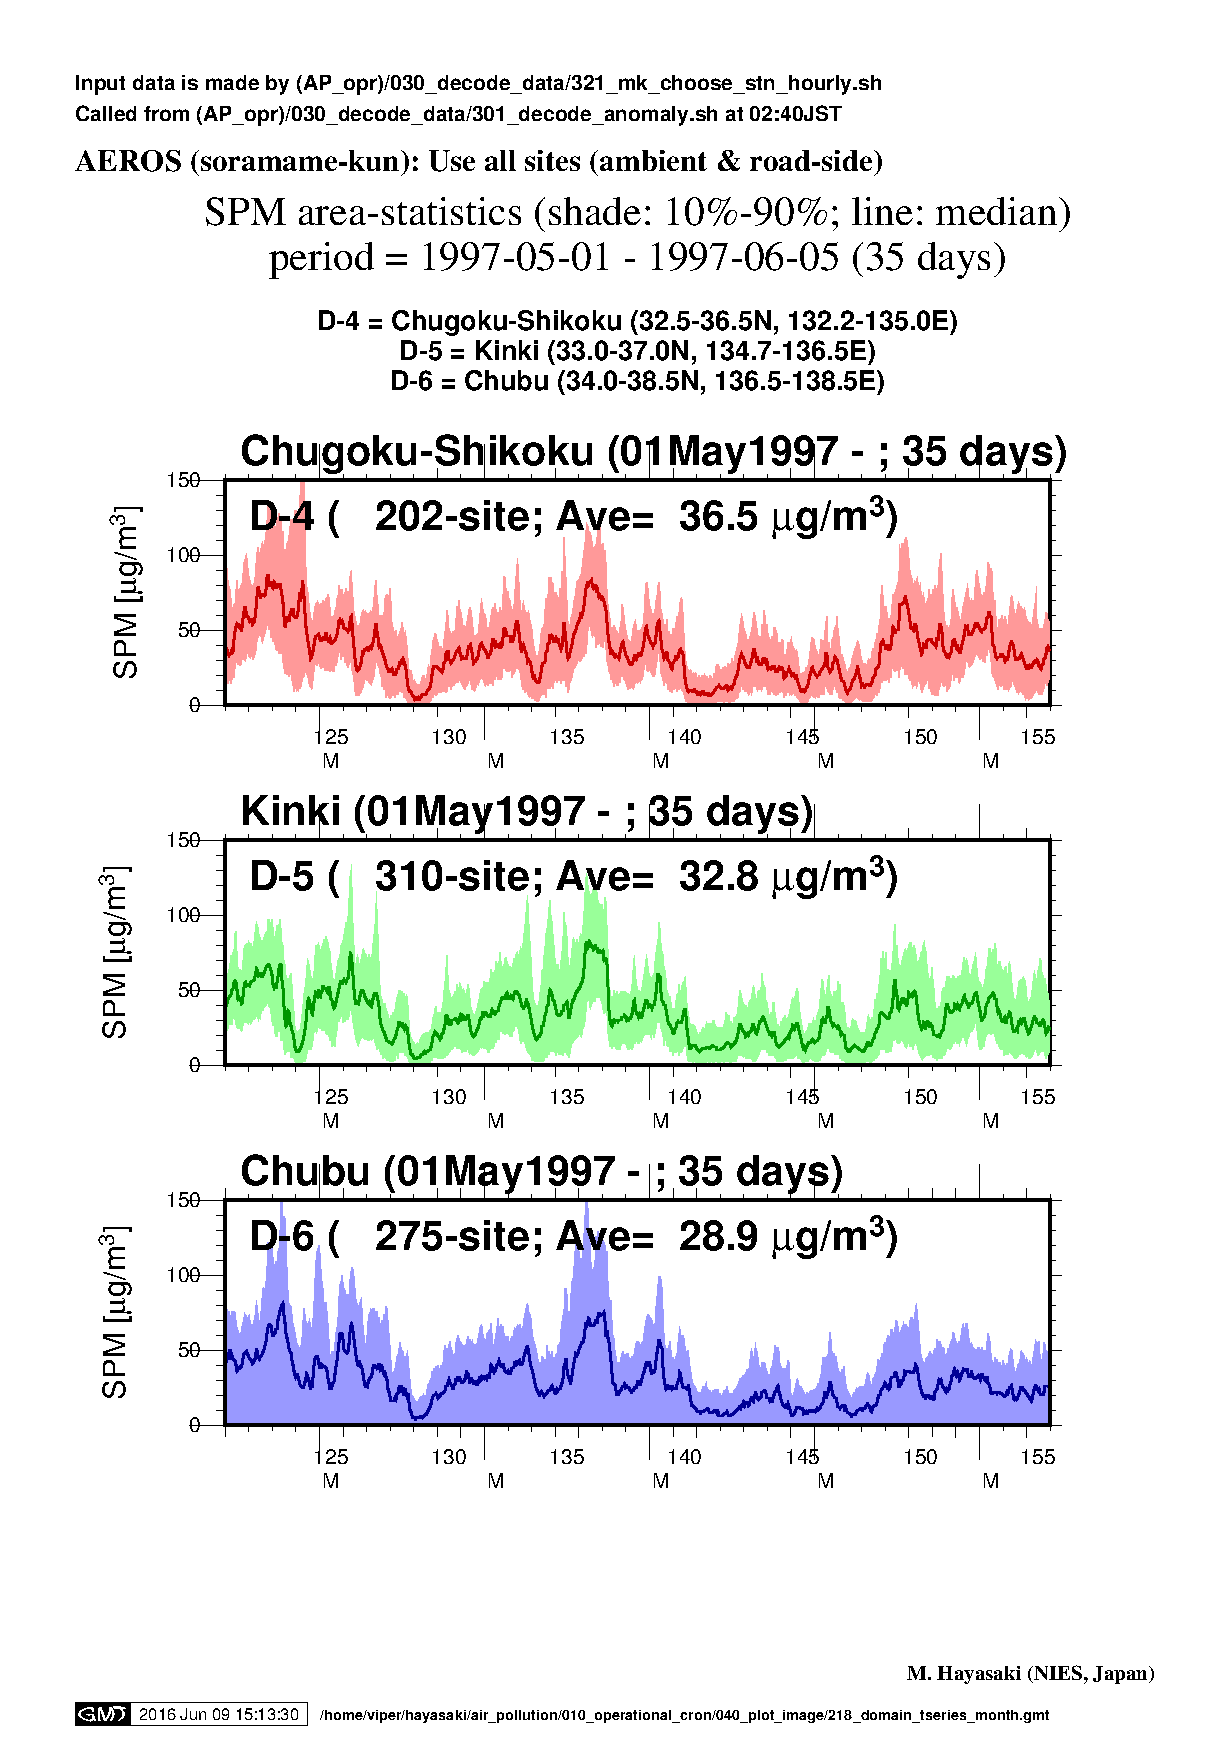
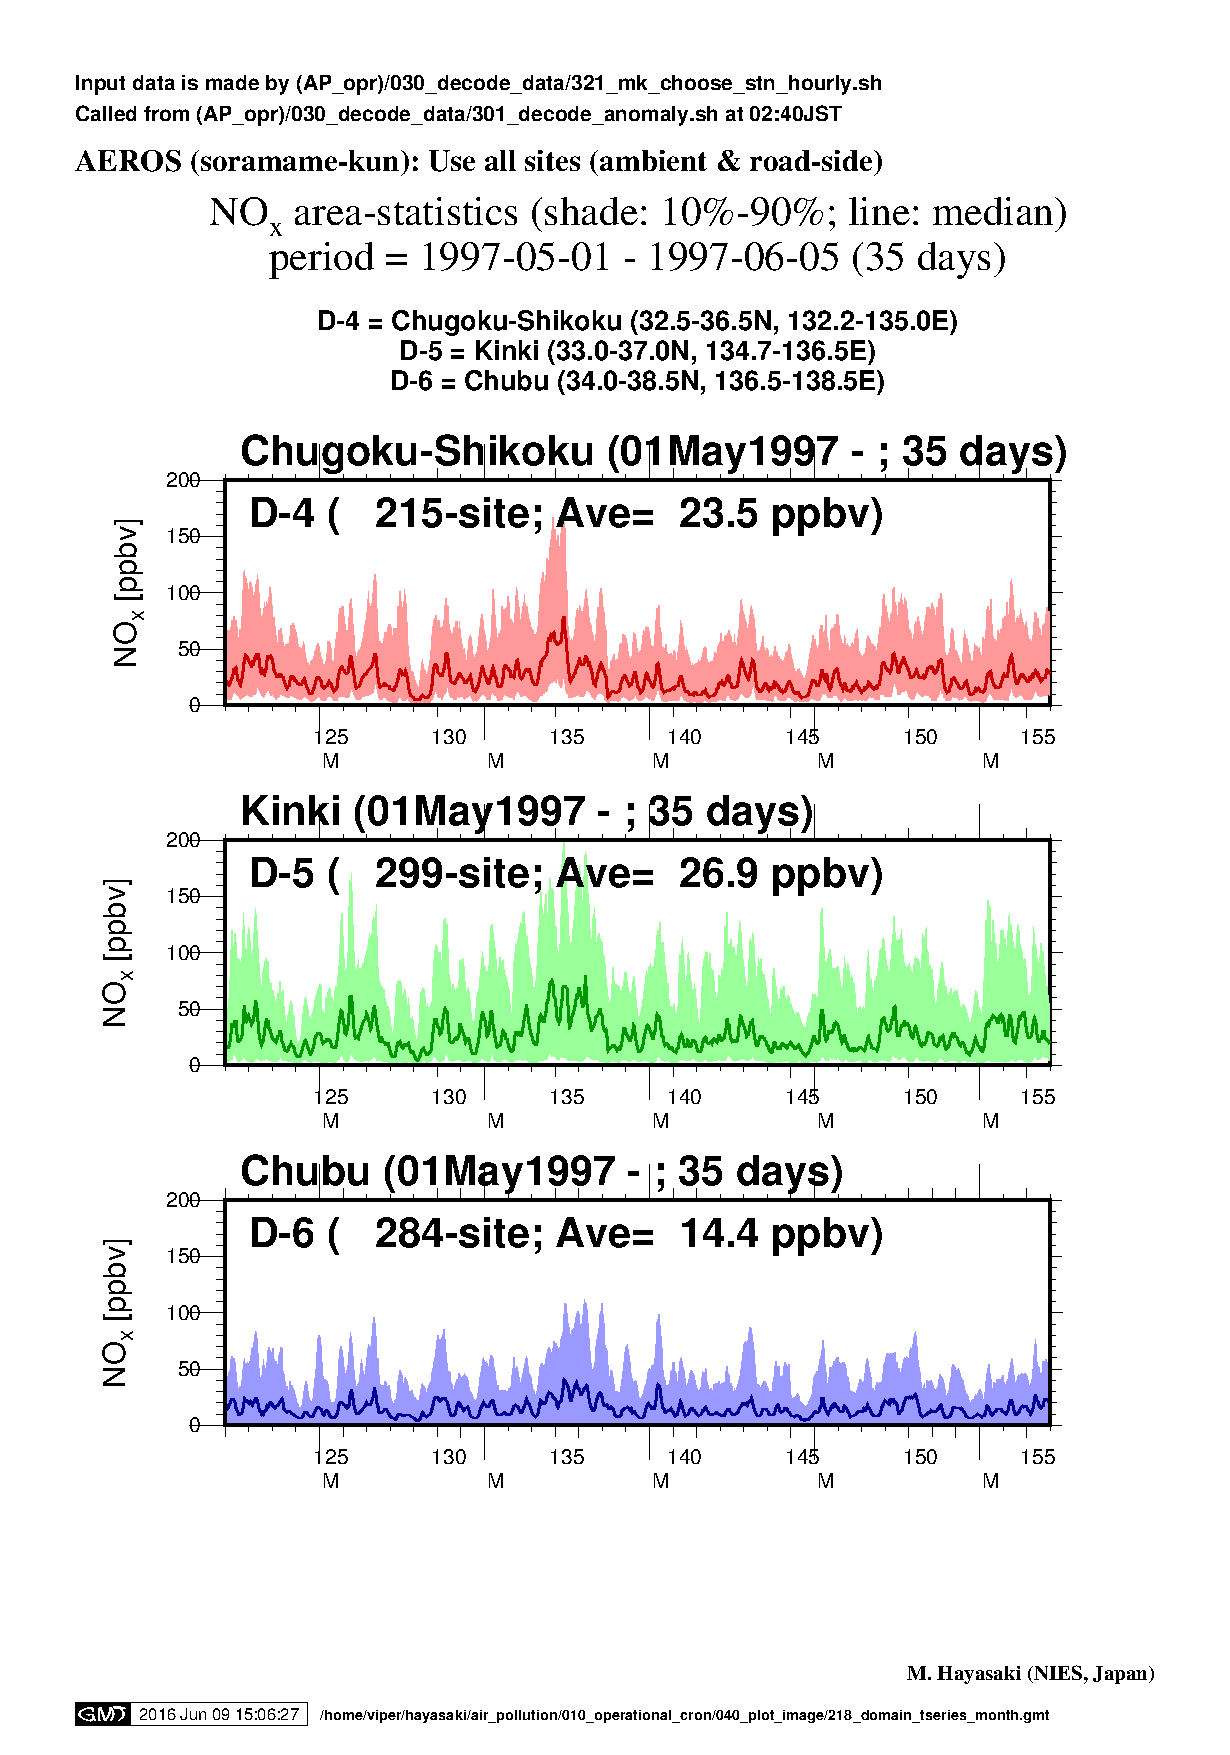
| May1997 (D4 - 6) |
|
|
NA |
|
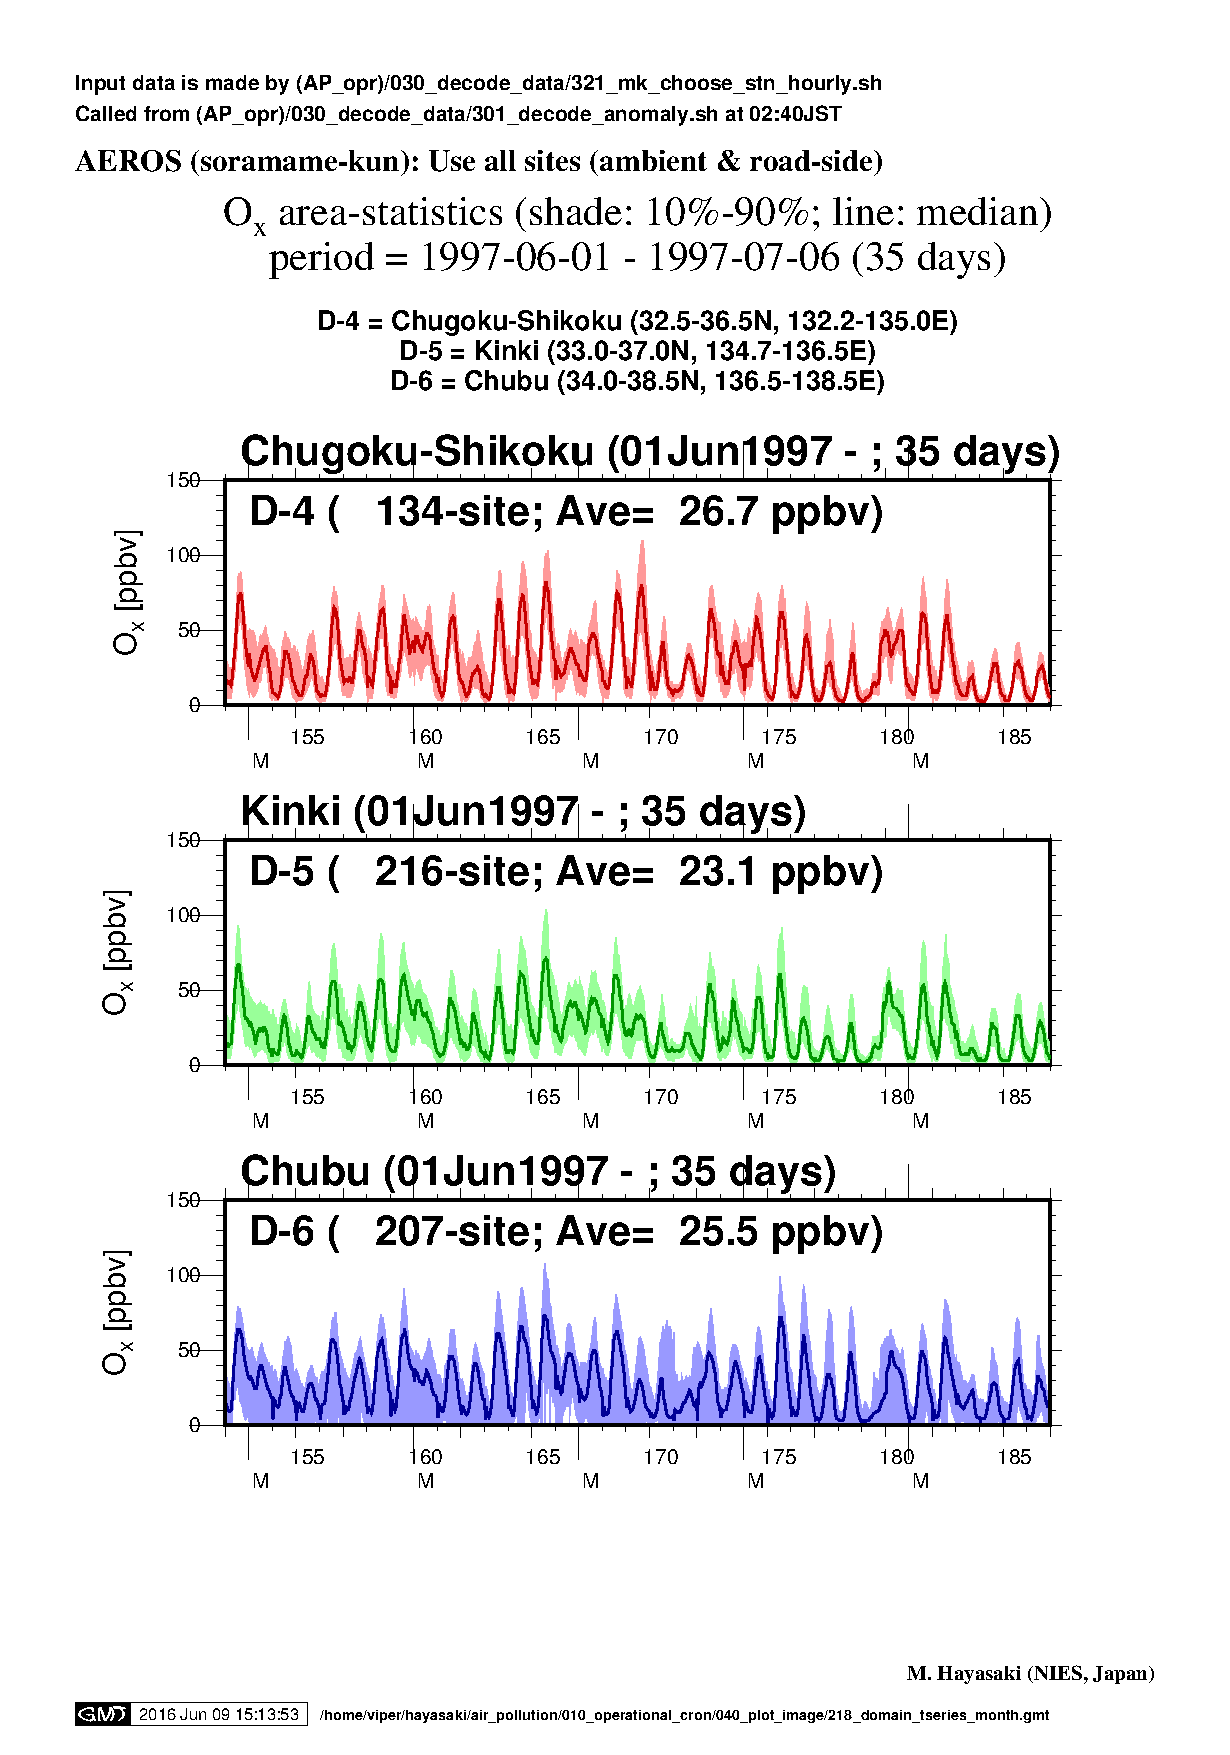
| Jun1997 (D4 - 6) |
|
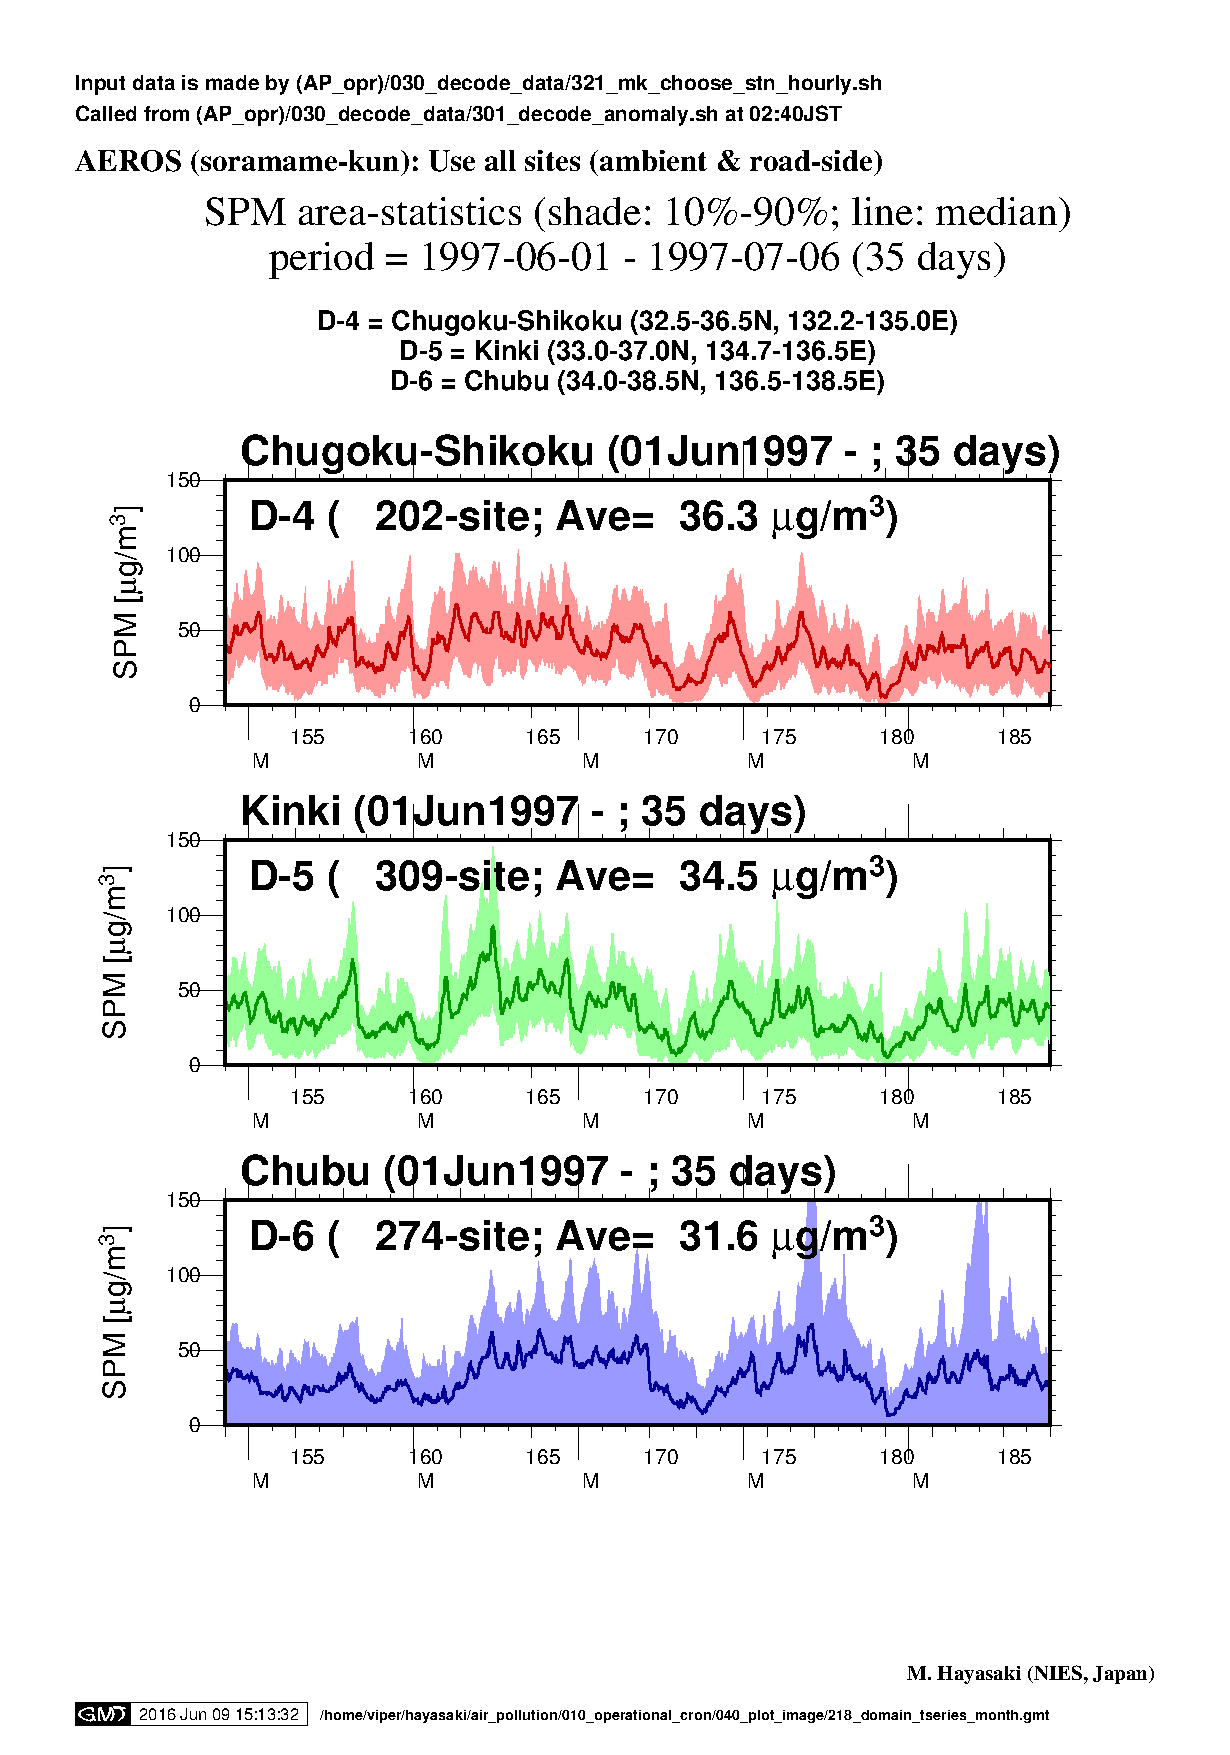
|
NA |
|
| Month | Ox | SPM | PM2.5 | NOx |
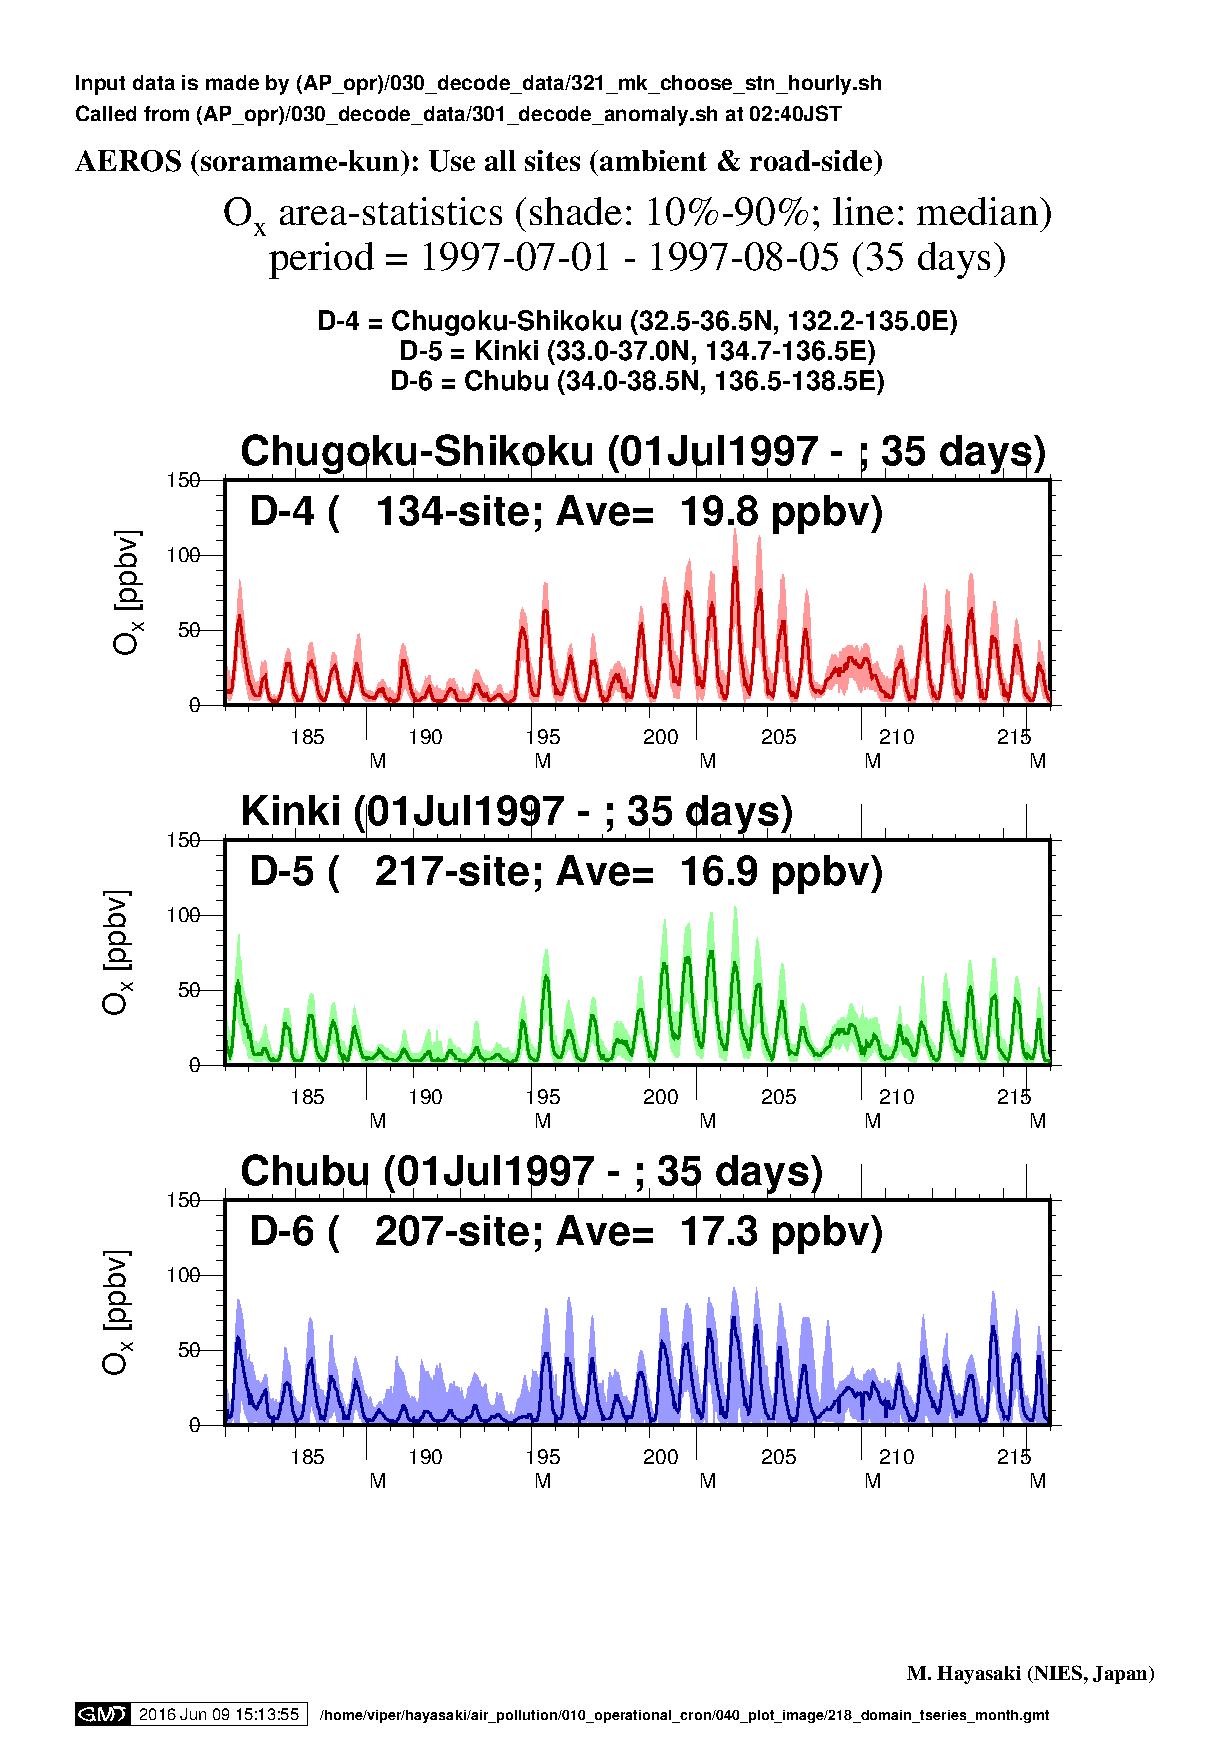
| Jul1997 (D4 - 6) |
|
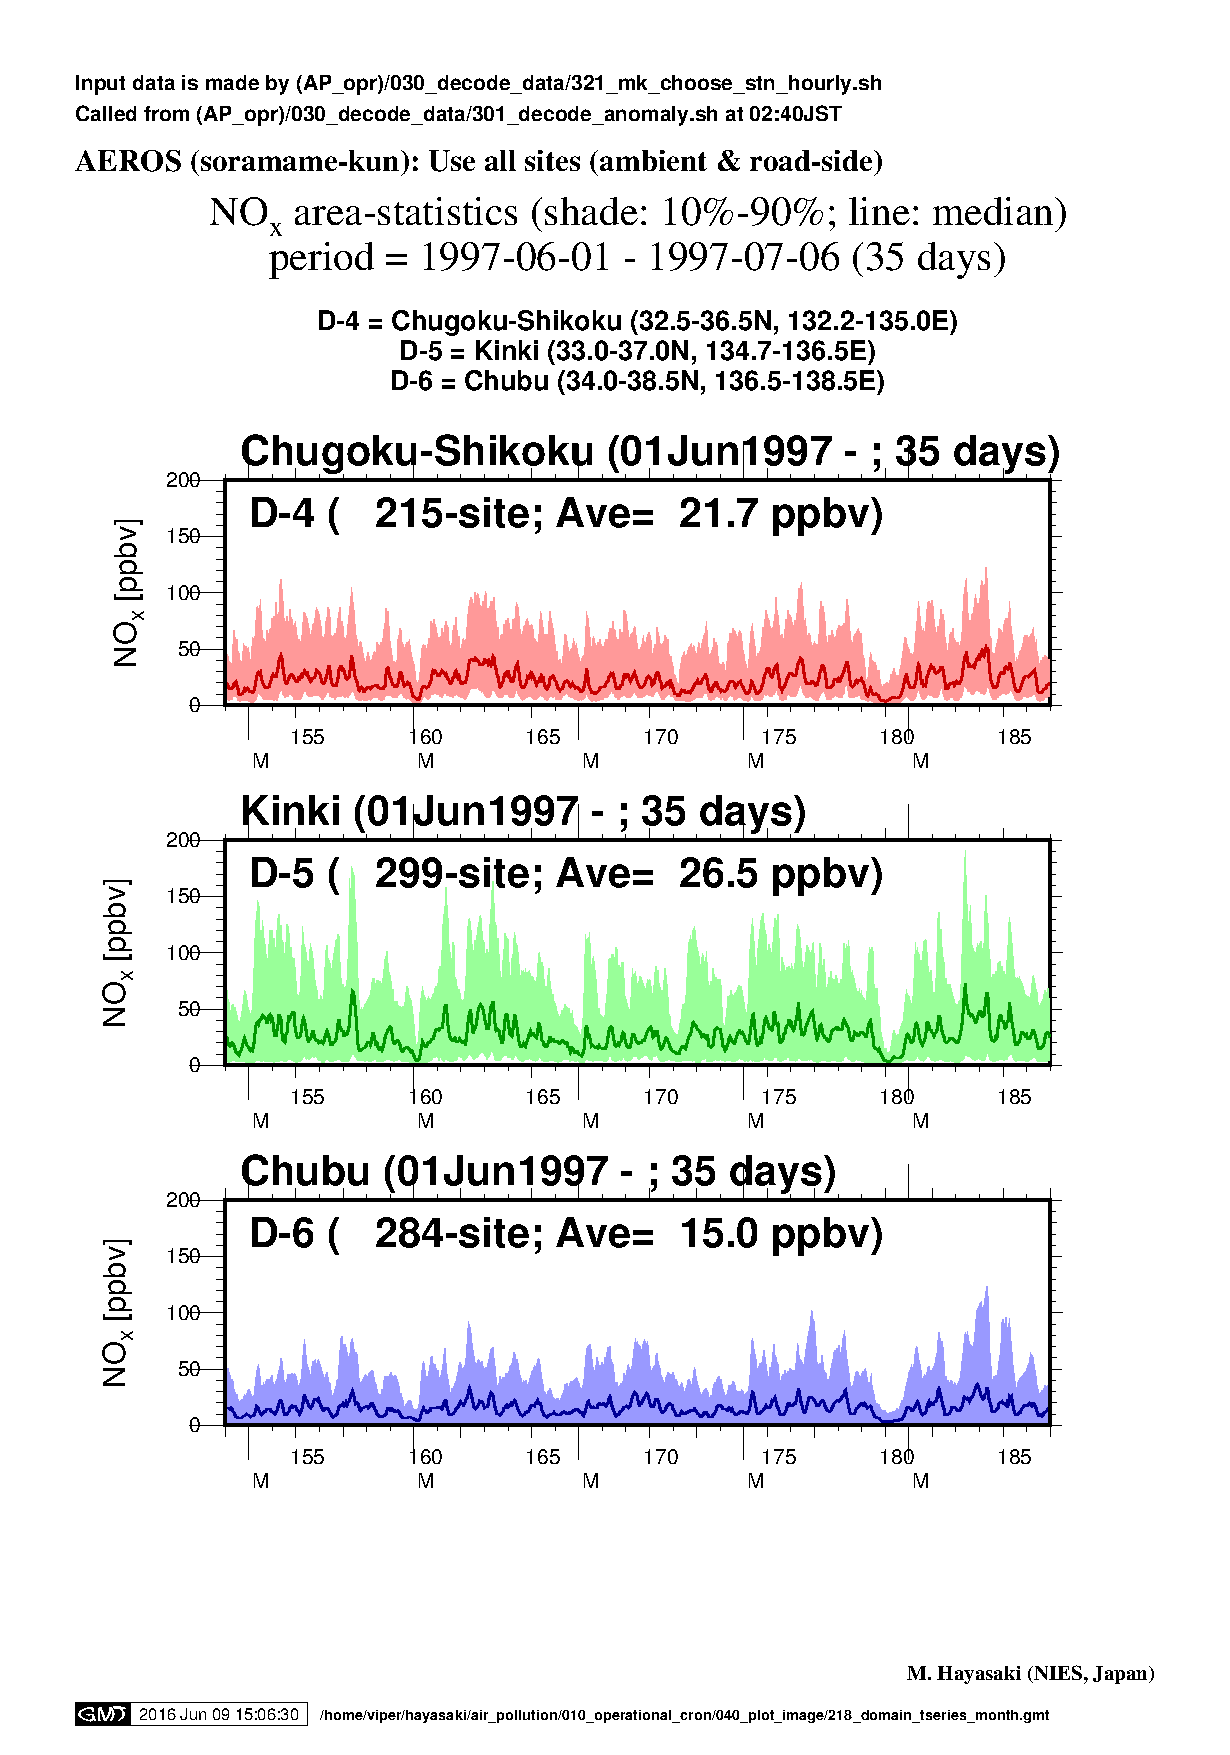
|
NA |
|
| Aug1997 (D4 - 6) |
|
|
NA |
|
| Sep1997 (D4 - 6) |
|
|
NA |
|
| Month | Ox | SPM | PM2.5 | NOx |
| Oct1997 (D4 - 6) |

|

|
NA |
|
| Nov1997 (D4 - 6) |
|
|
NA |
|
| Dec1997 (D4 - 6) |
|

|
NA |
|
| Month | Ox | SPM | PM2.5 | NOx |
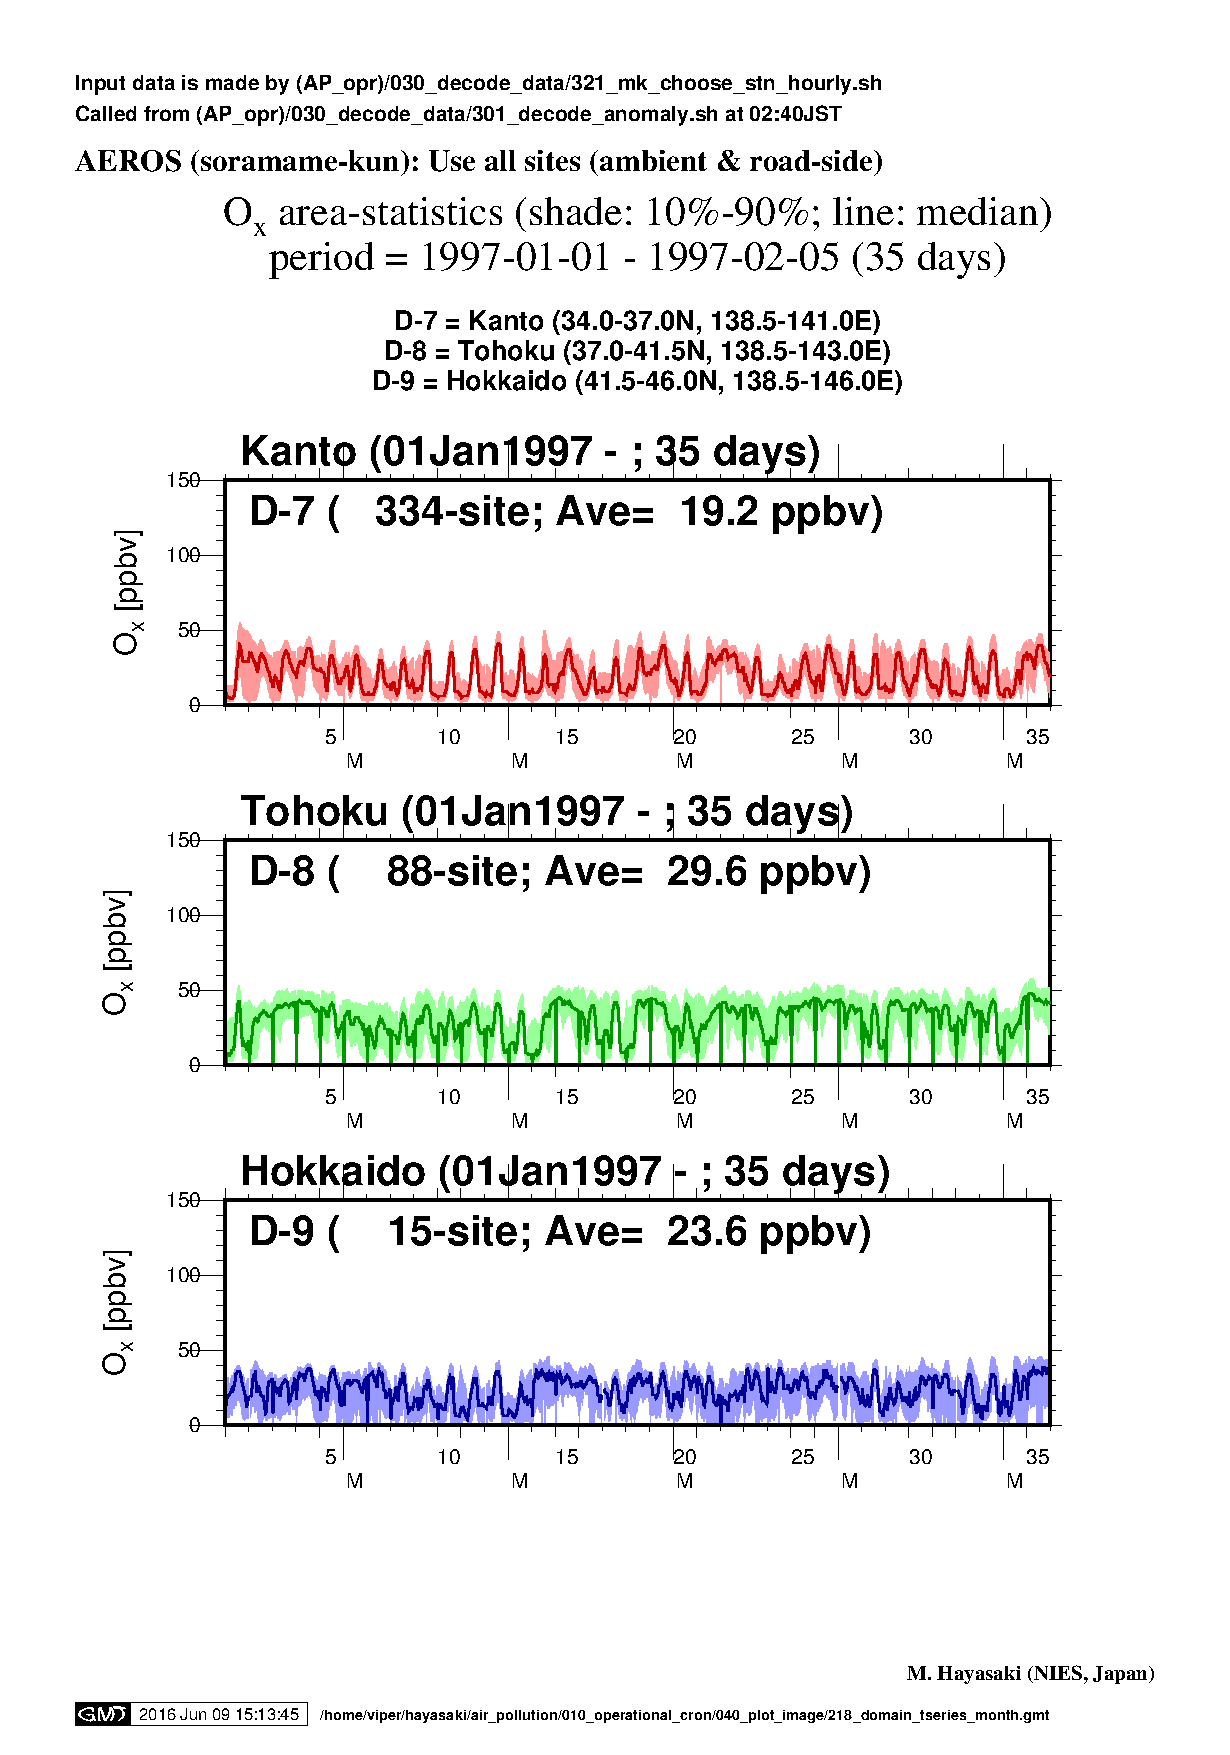
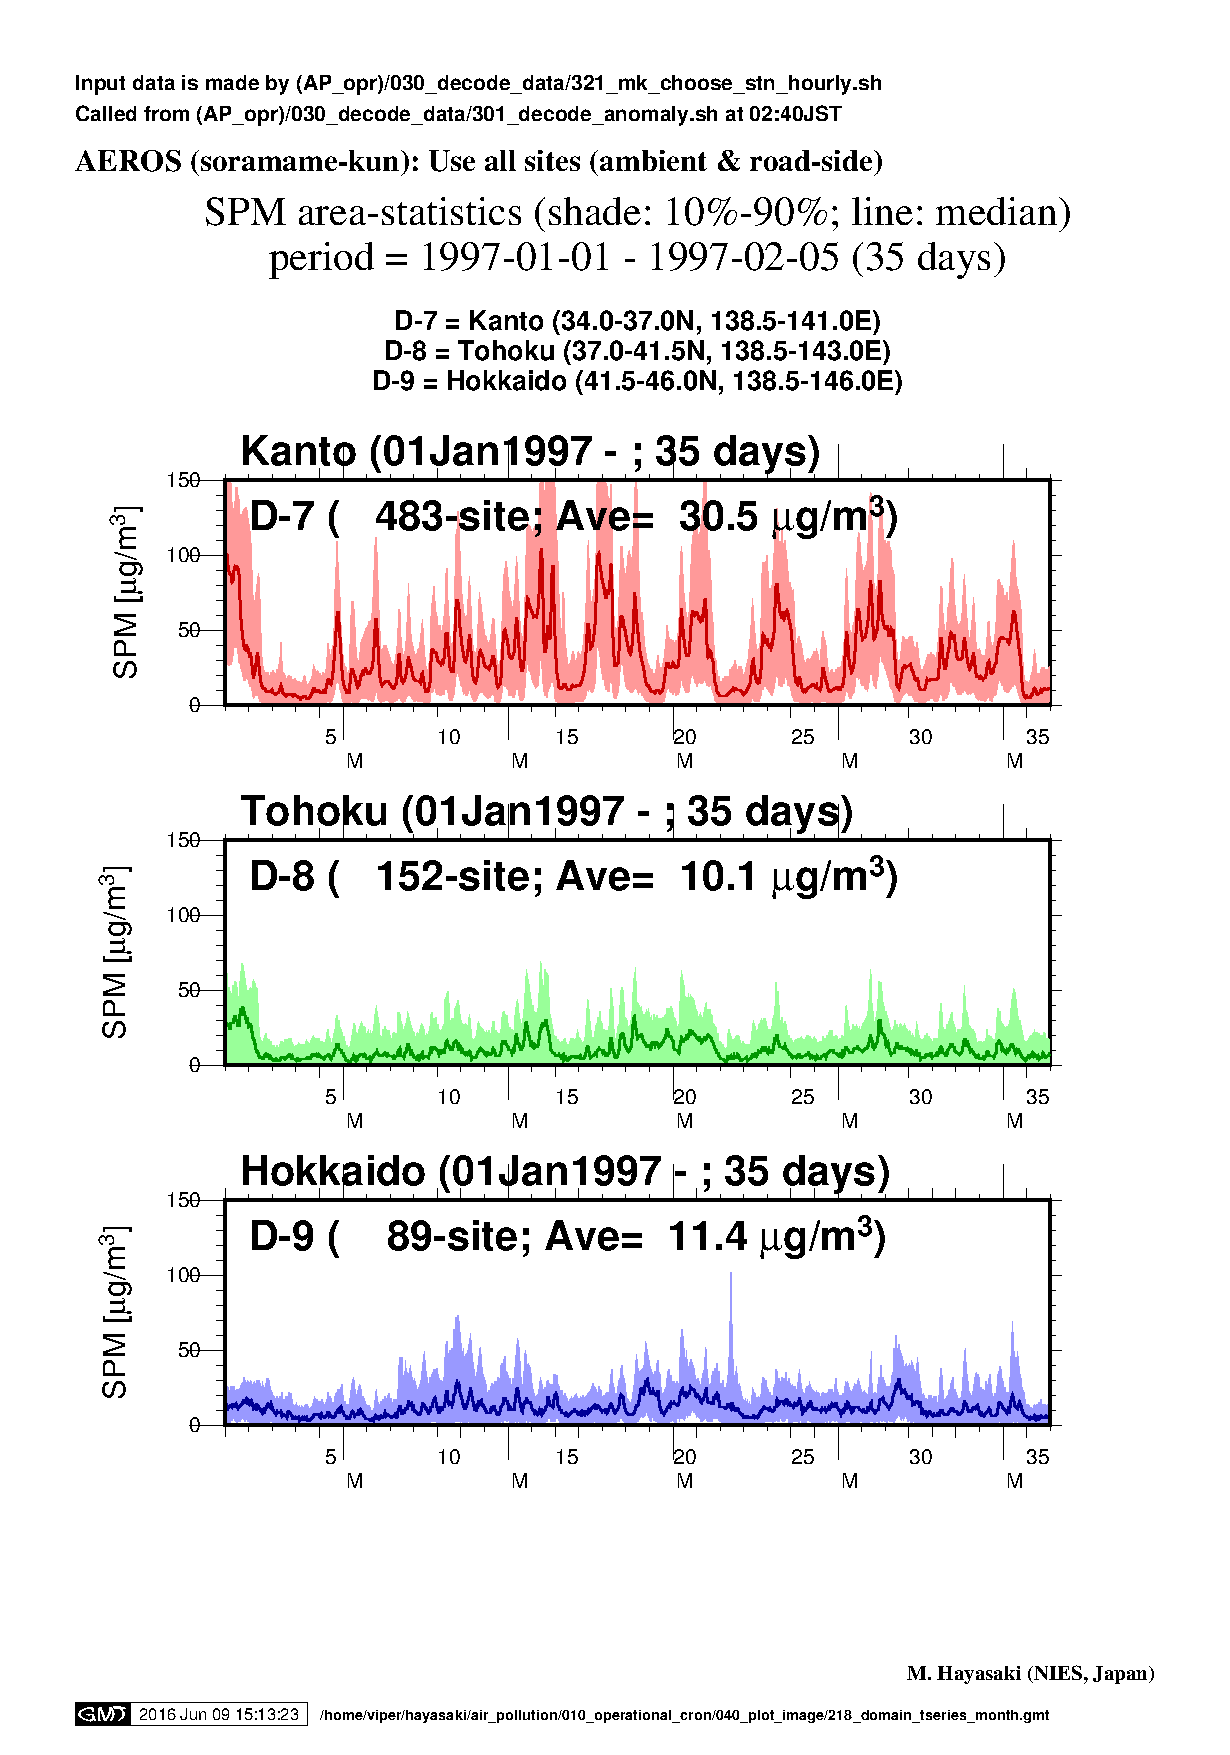
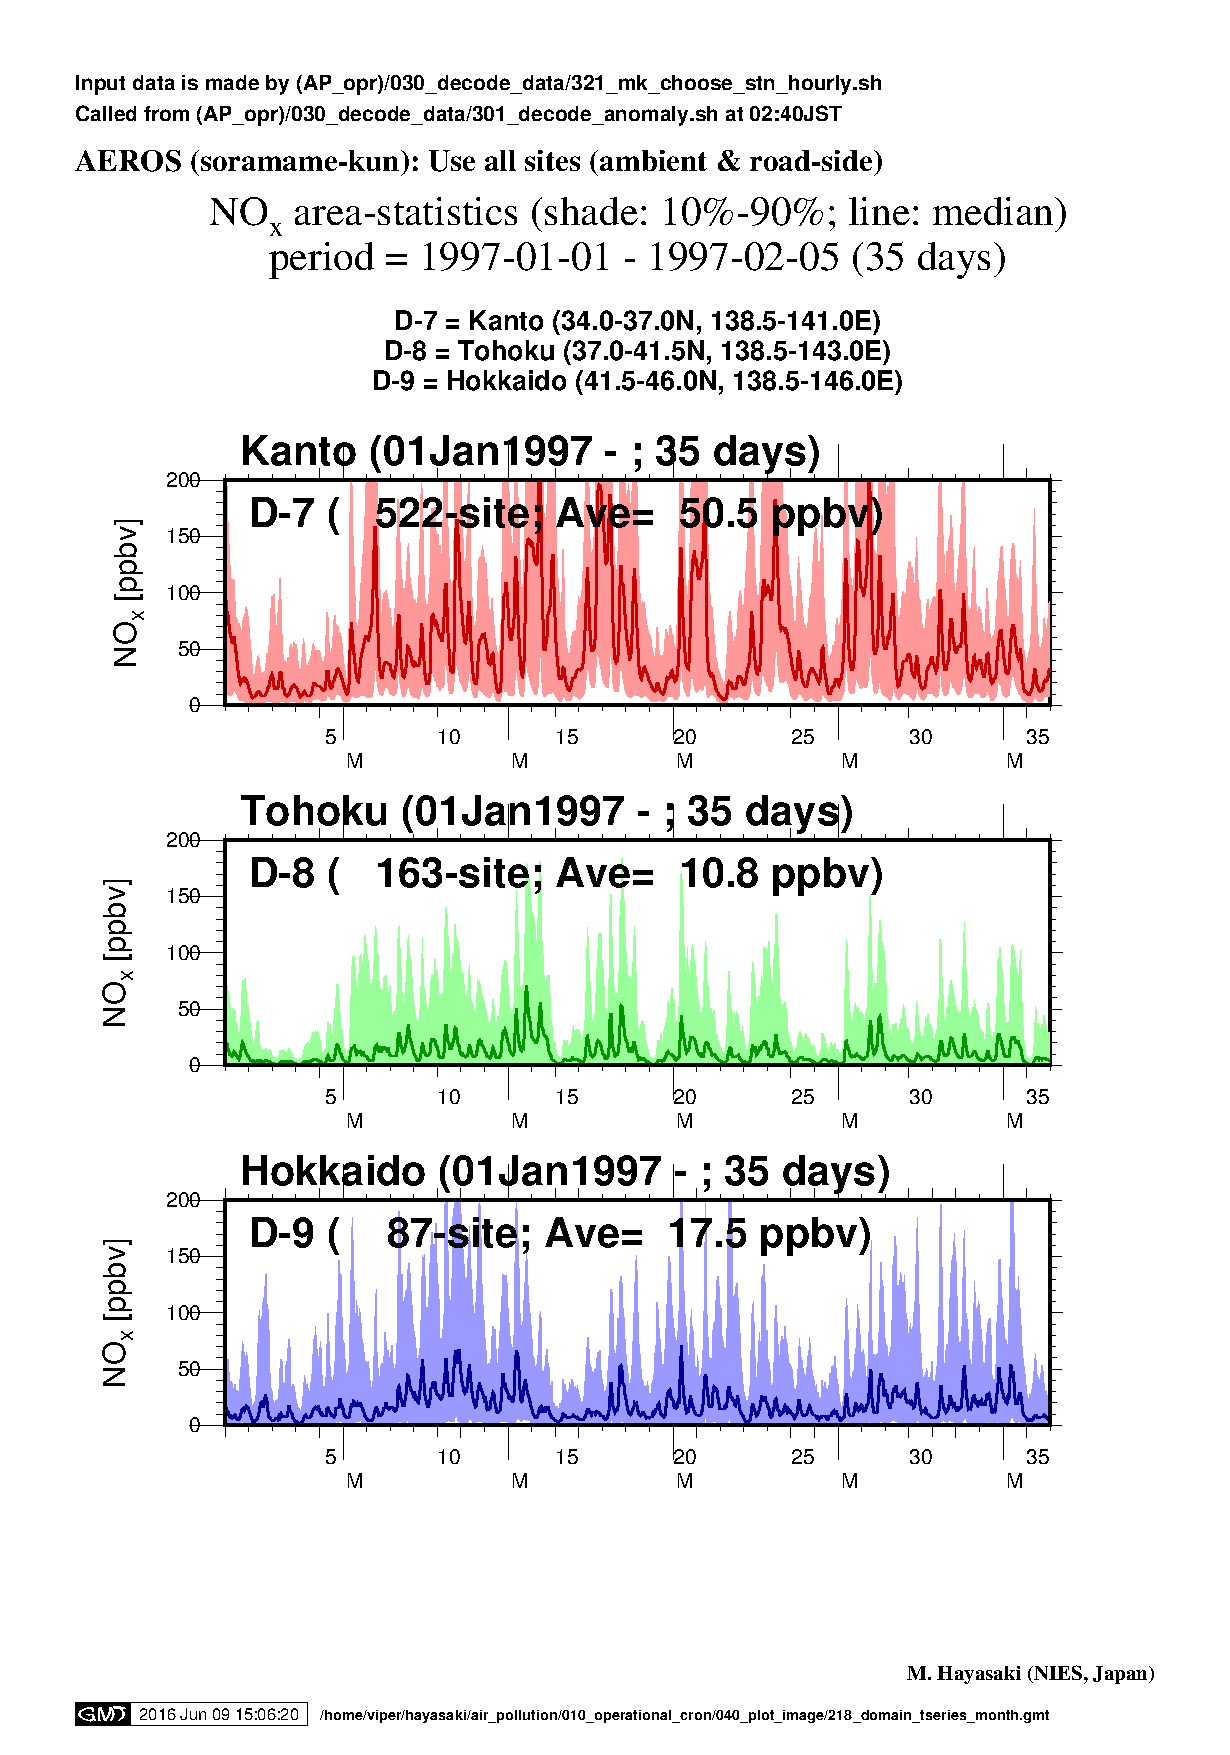
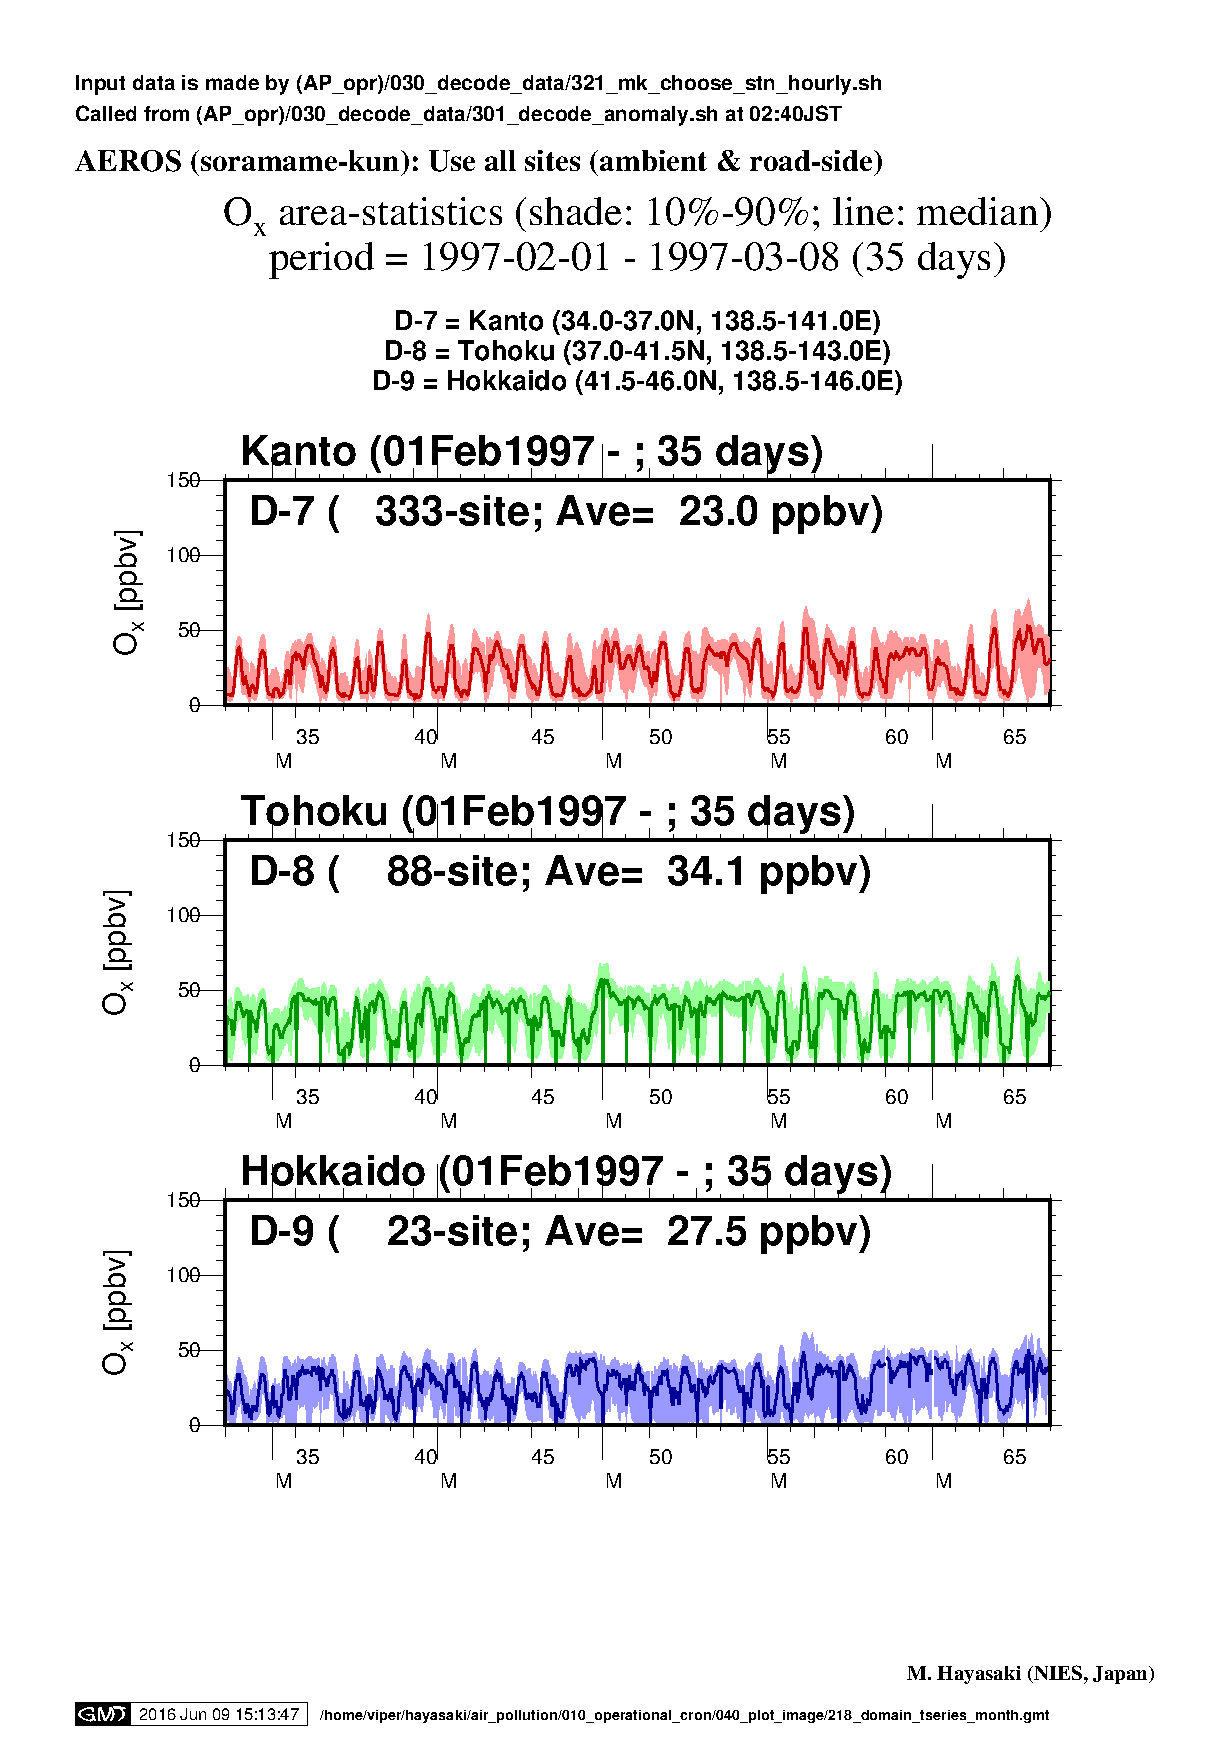
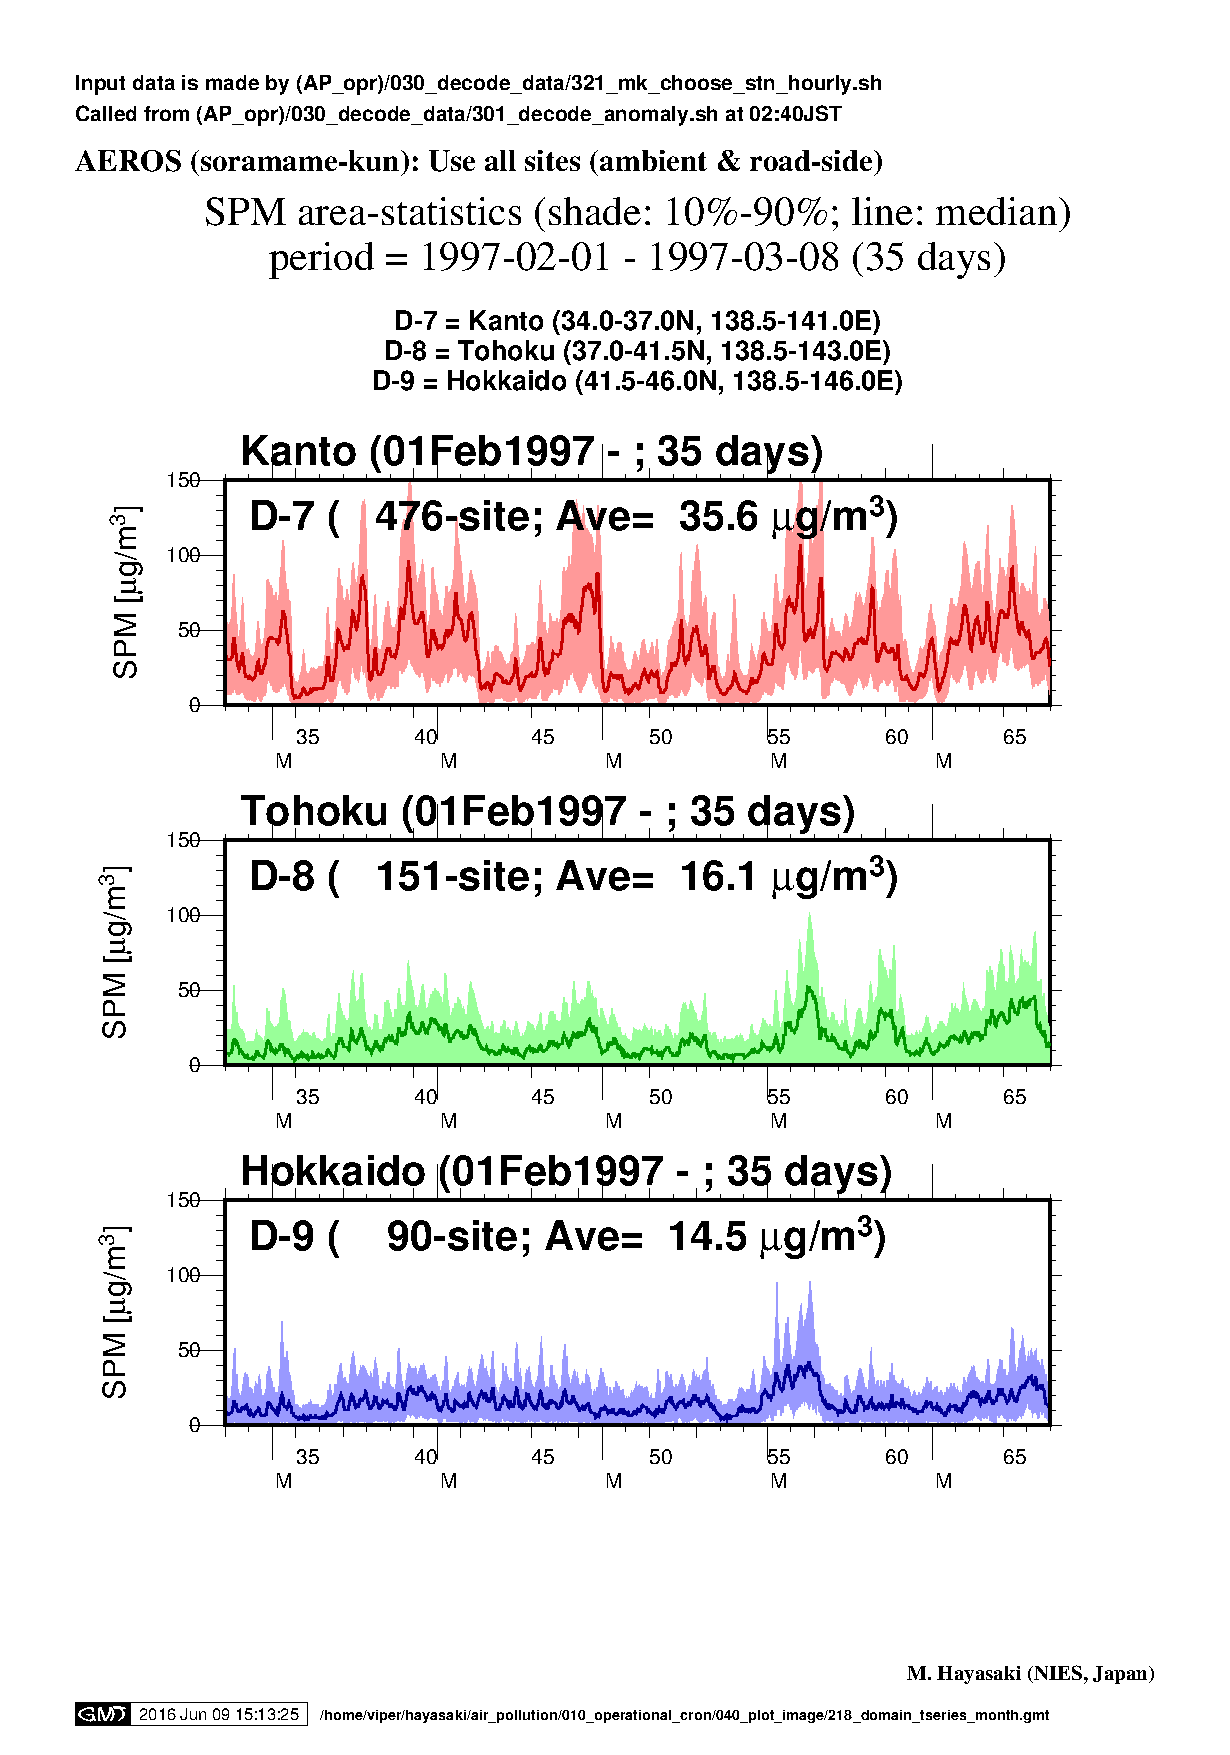
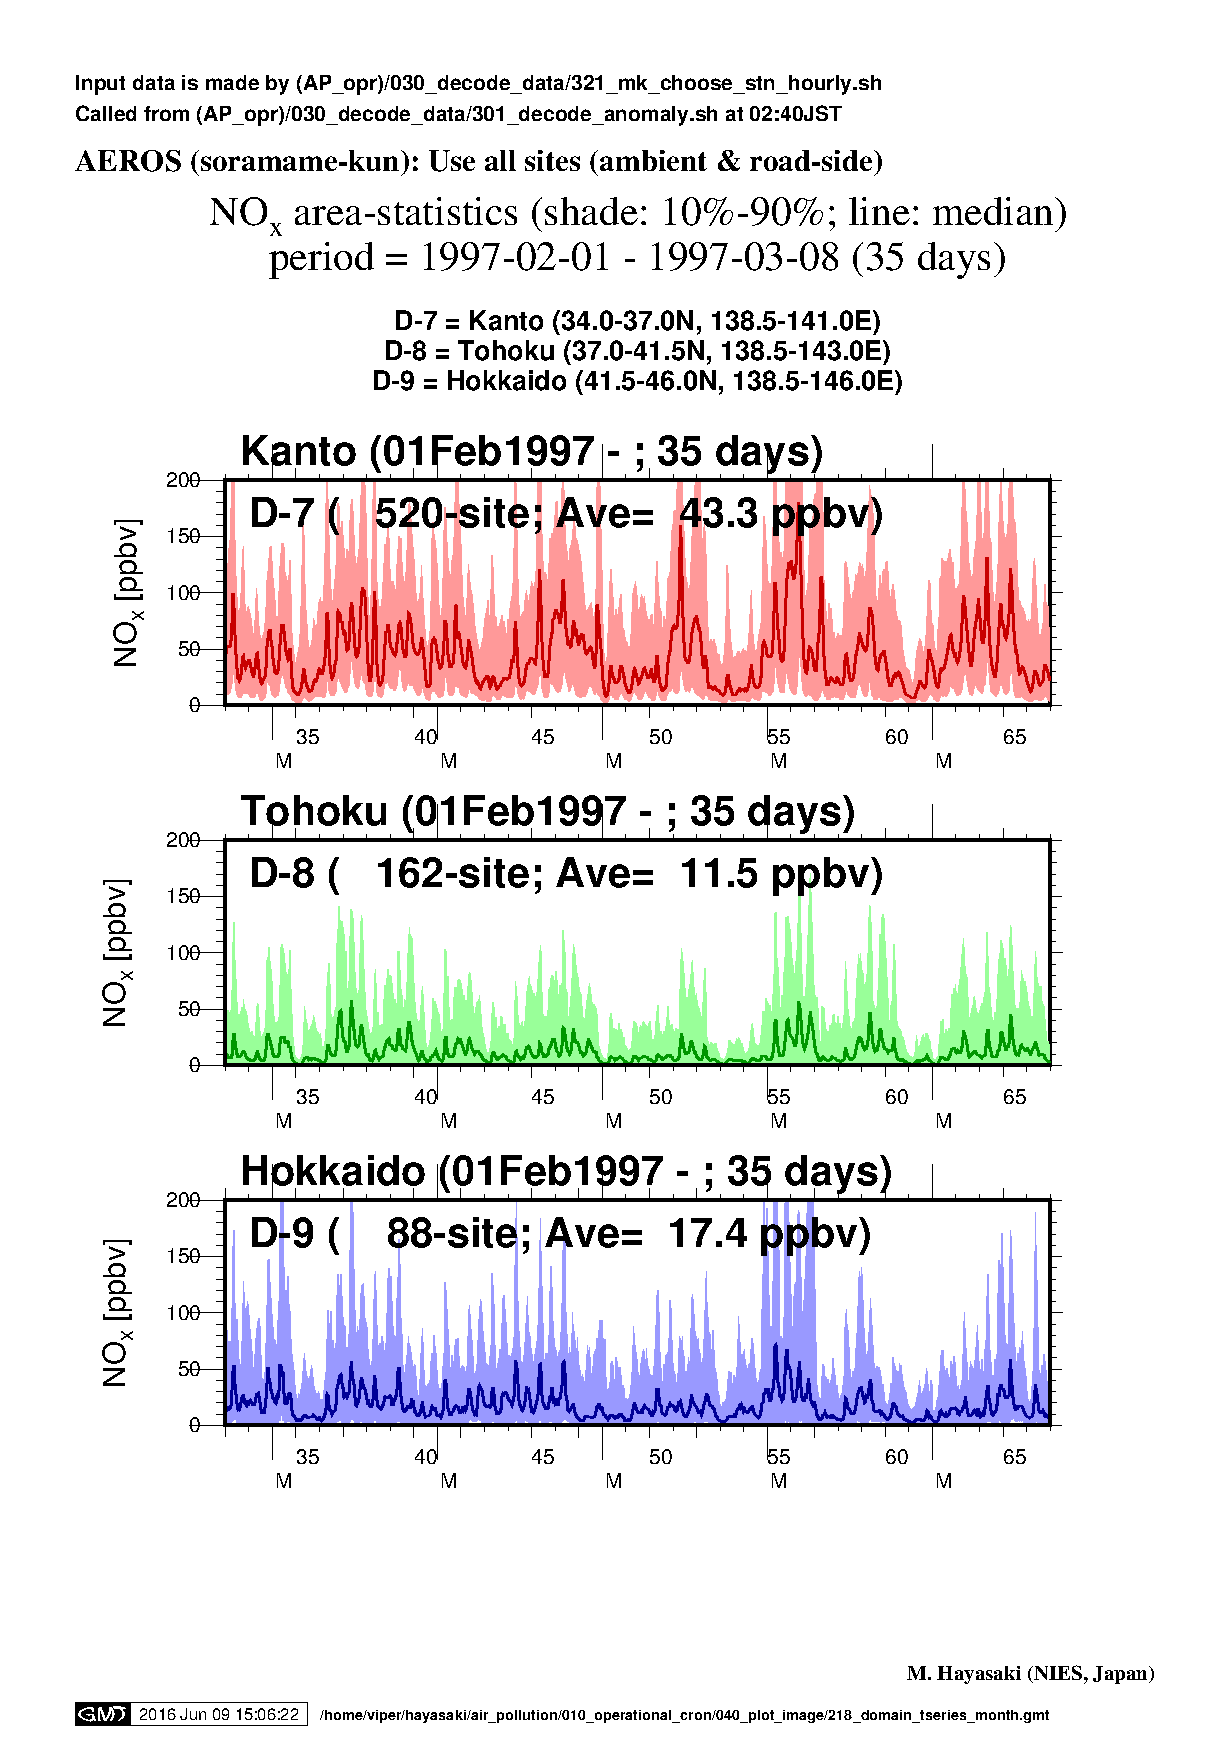
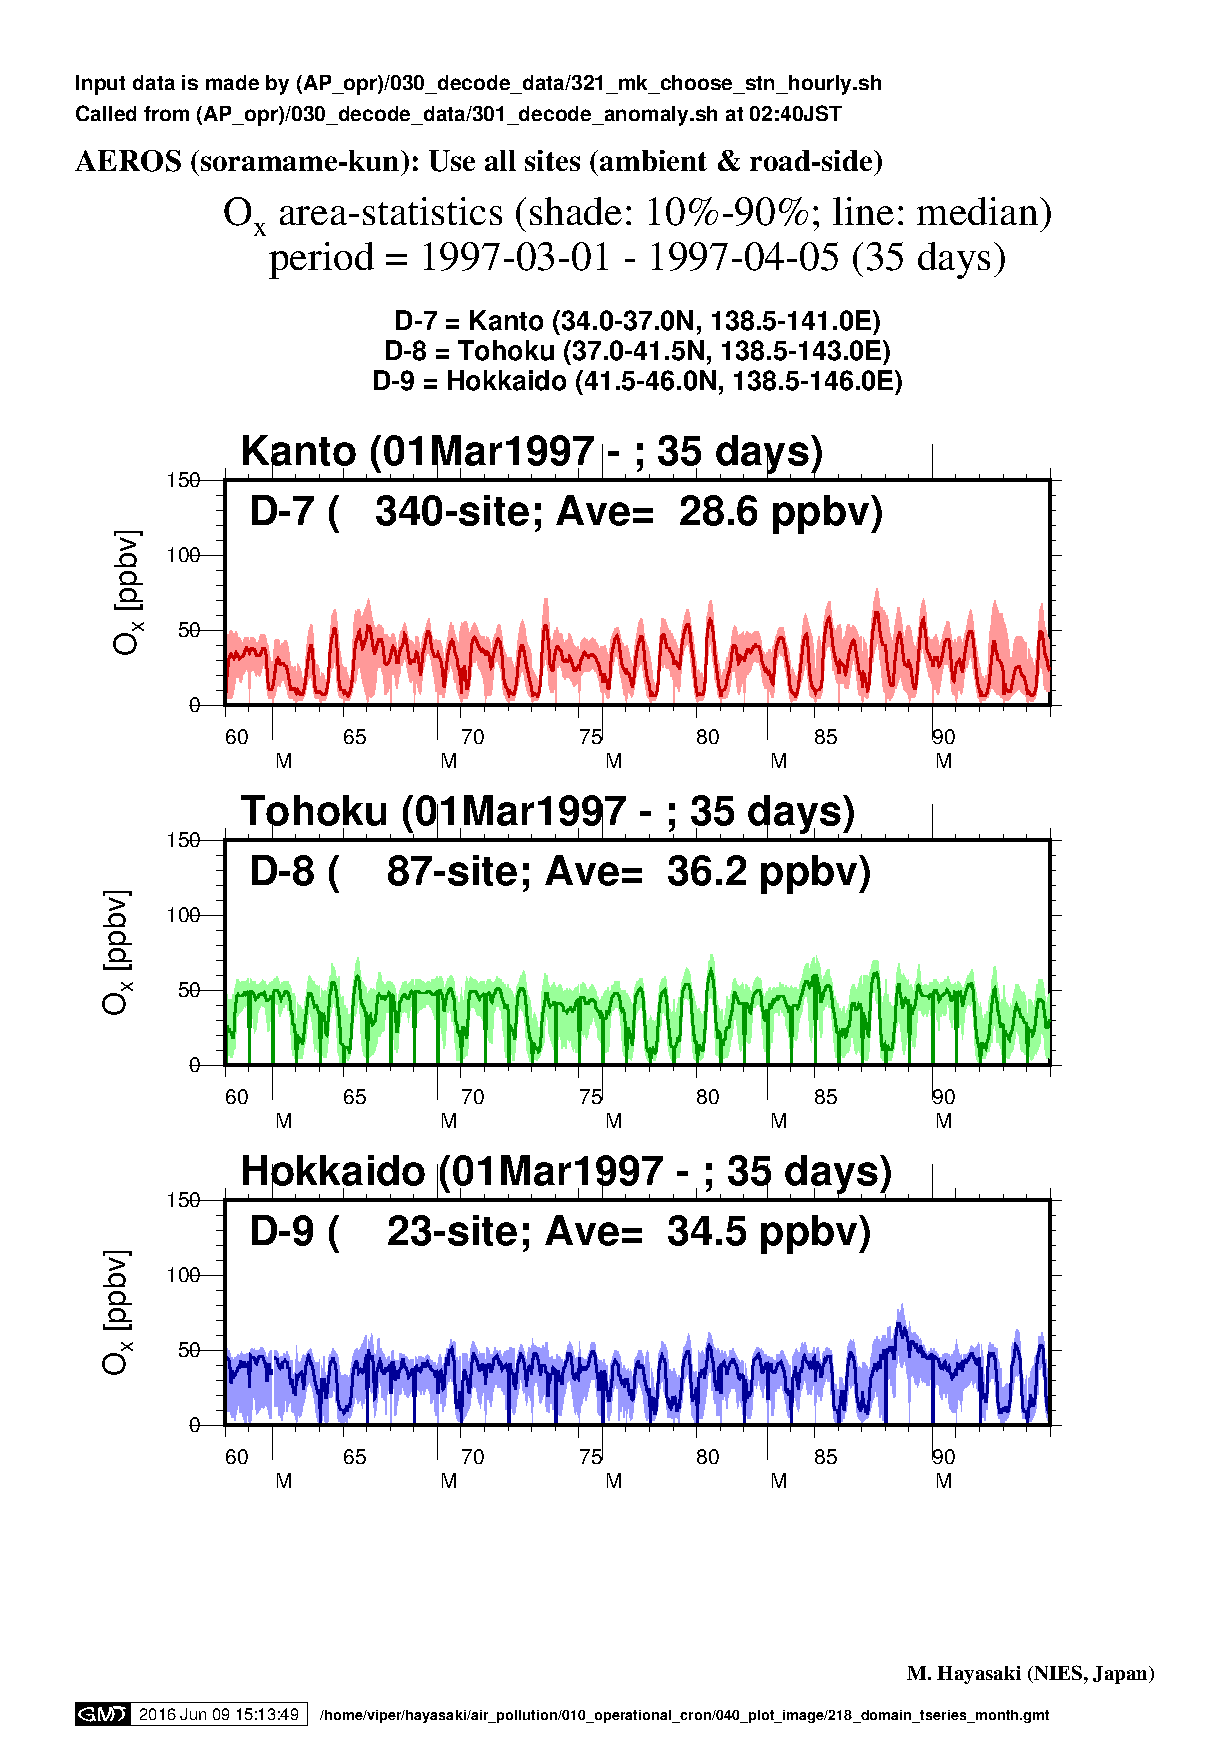
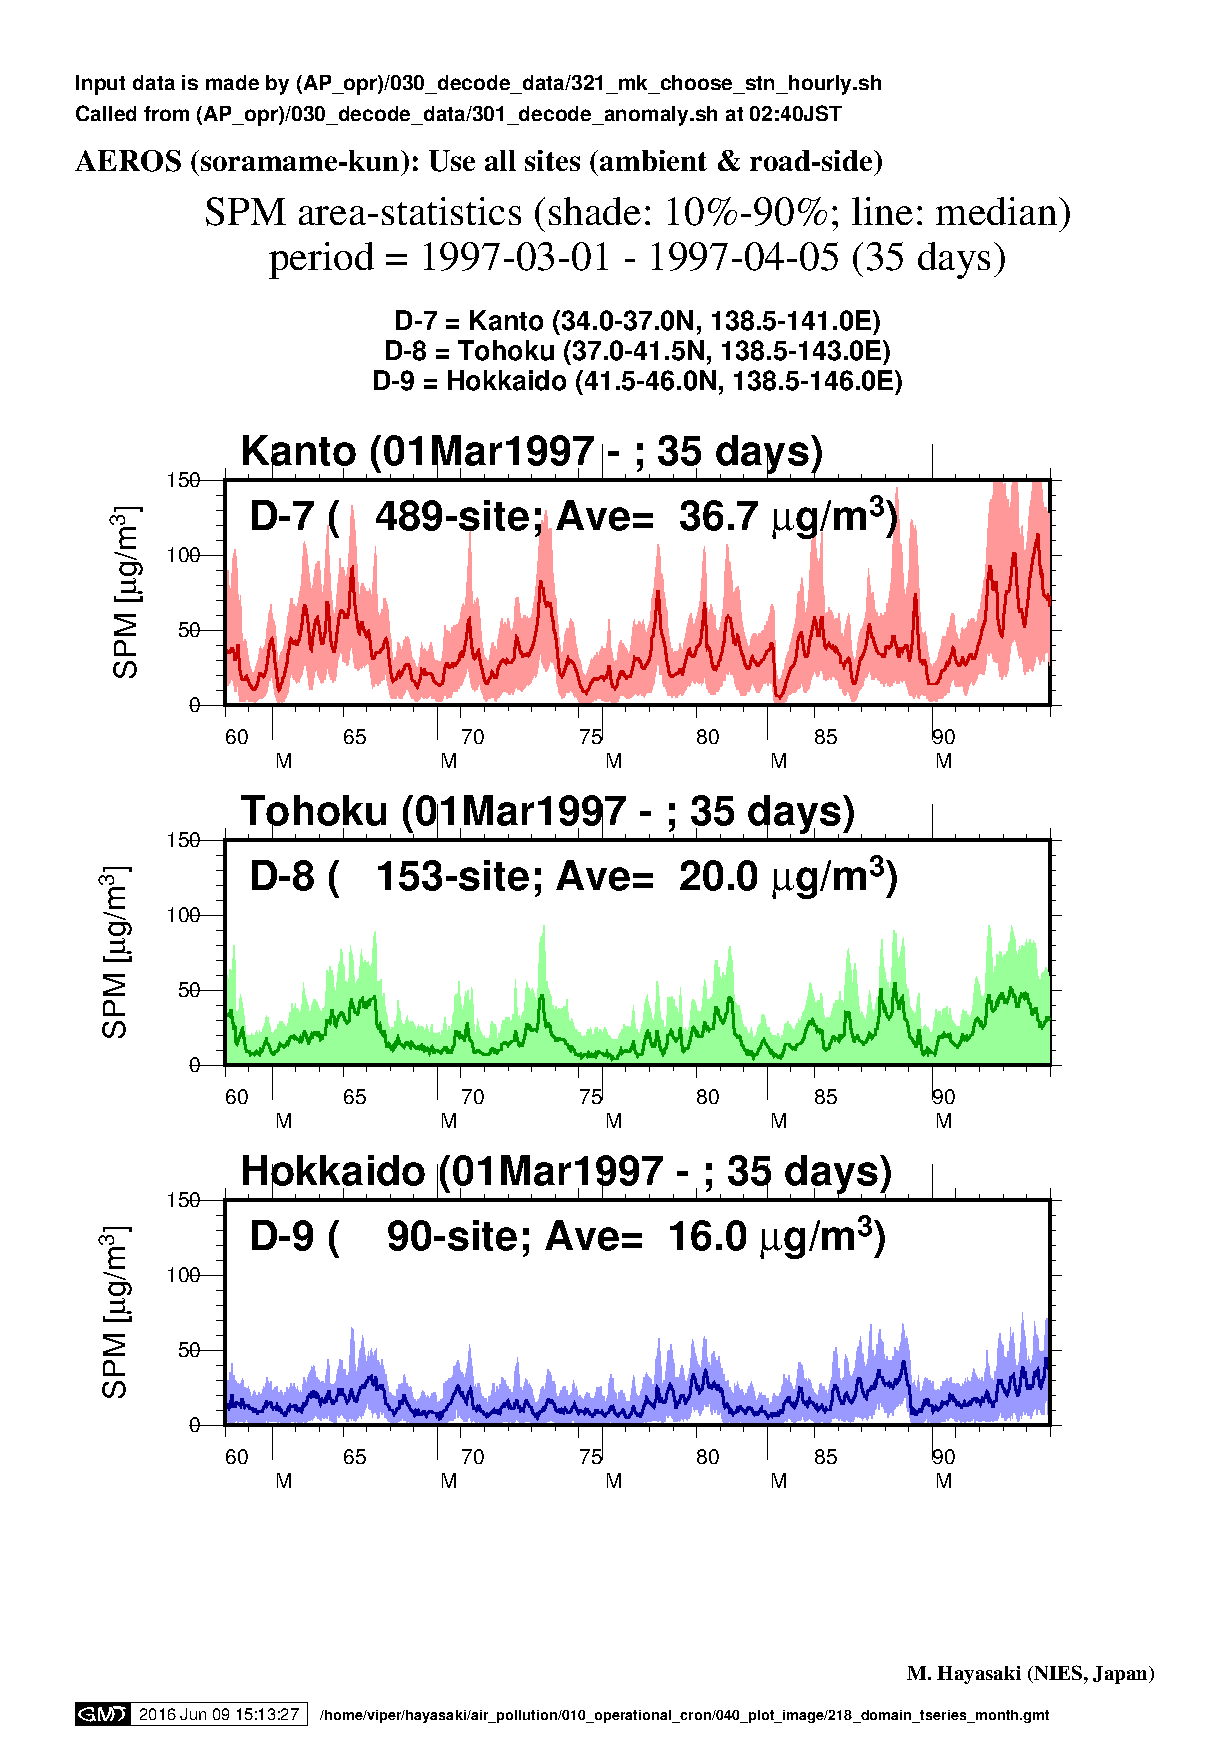
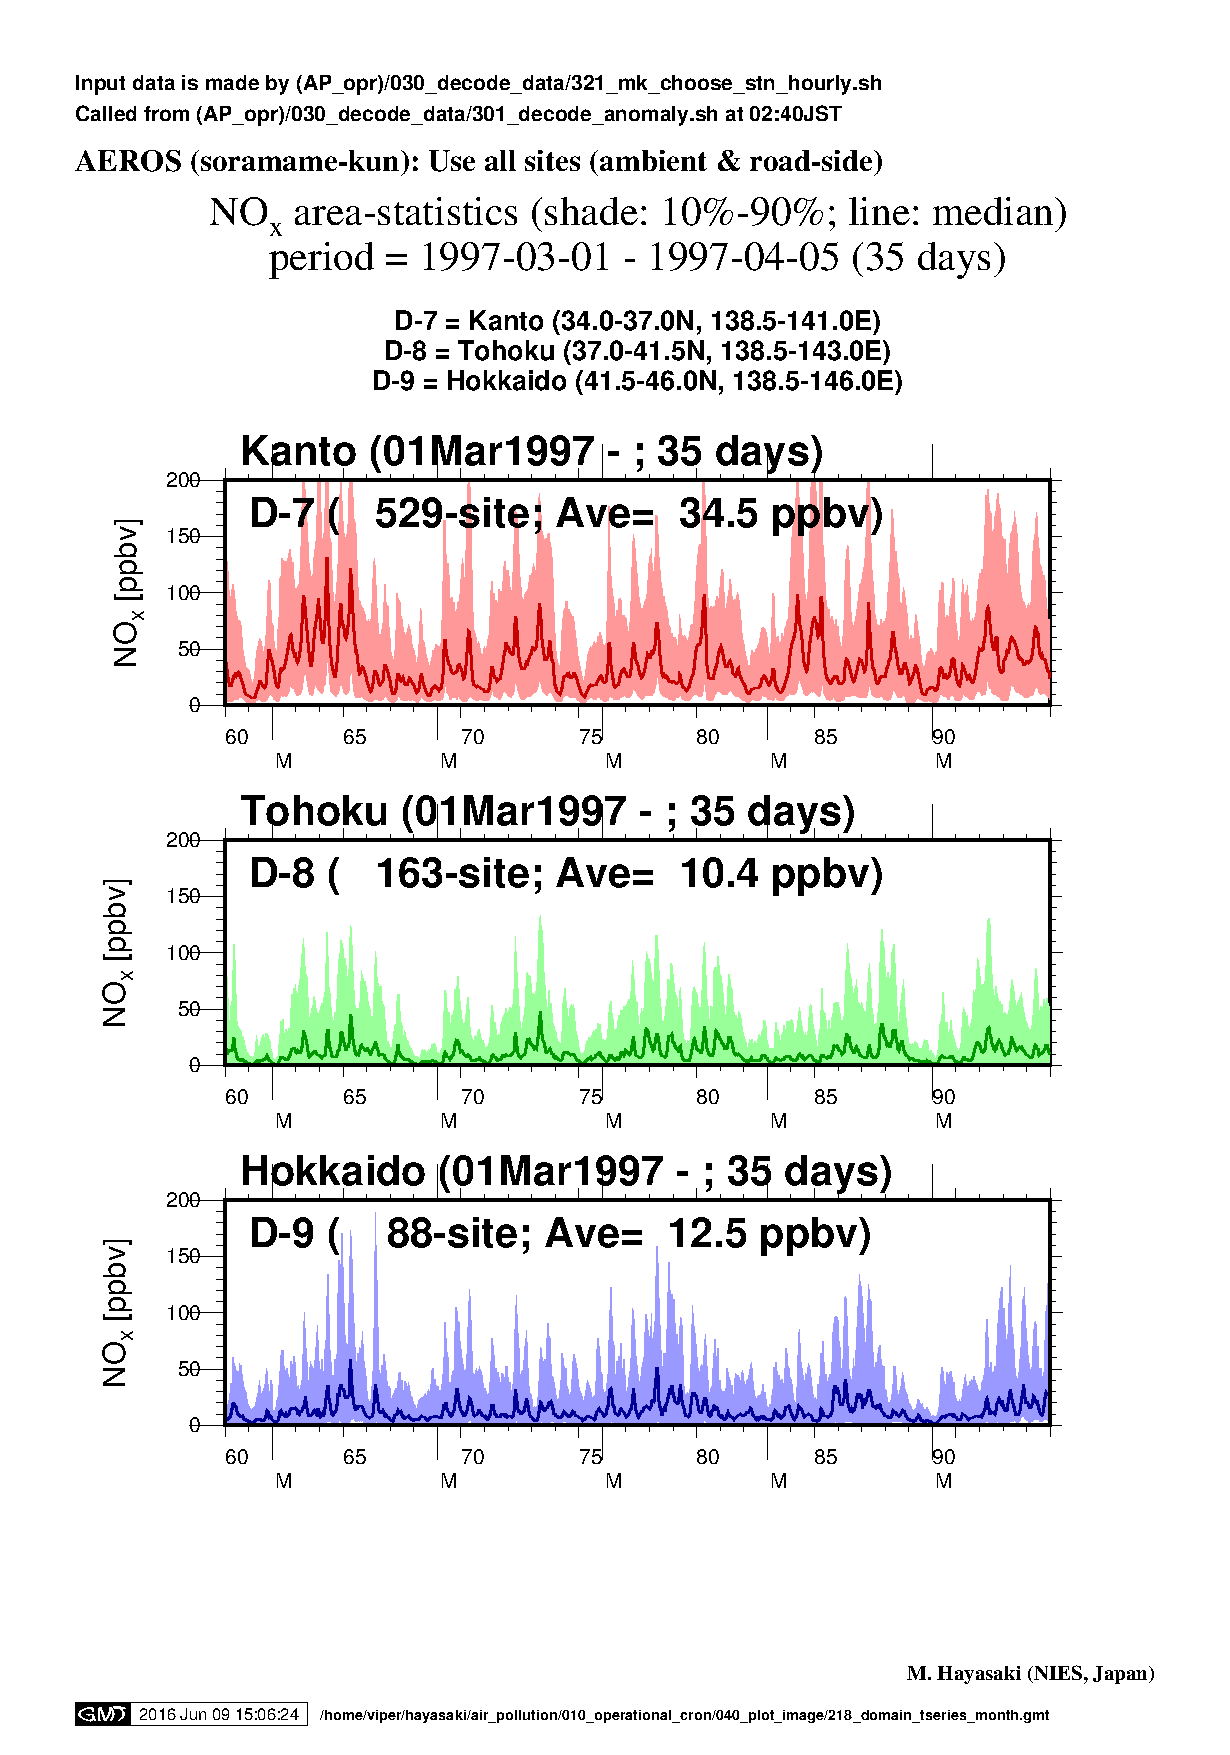
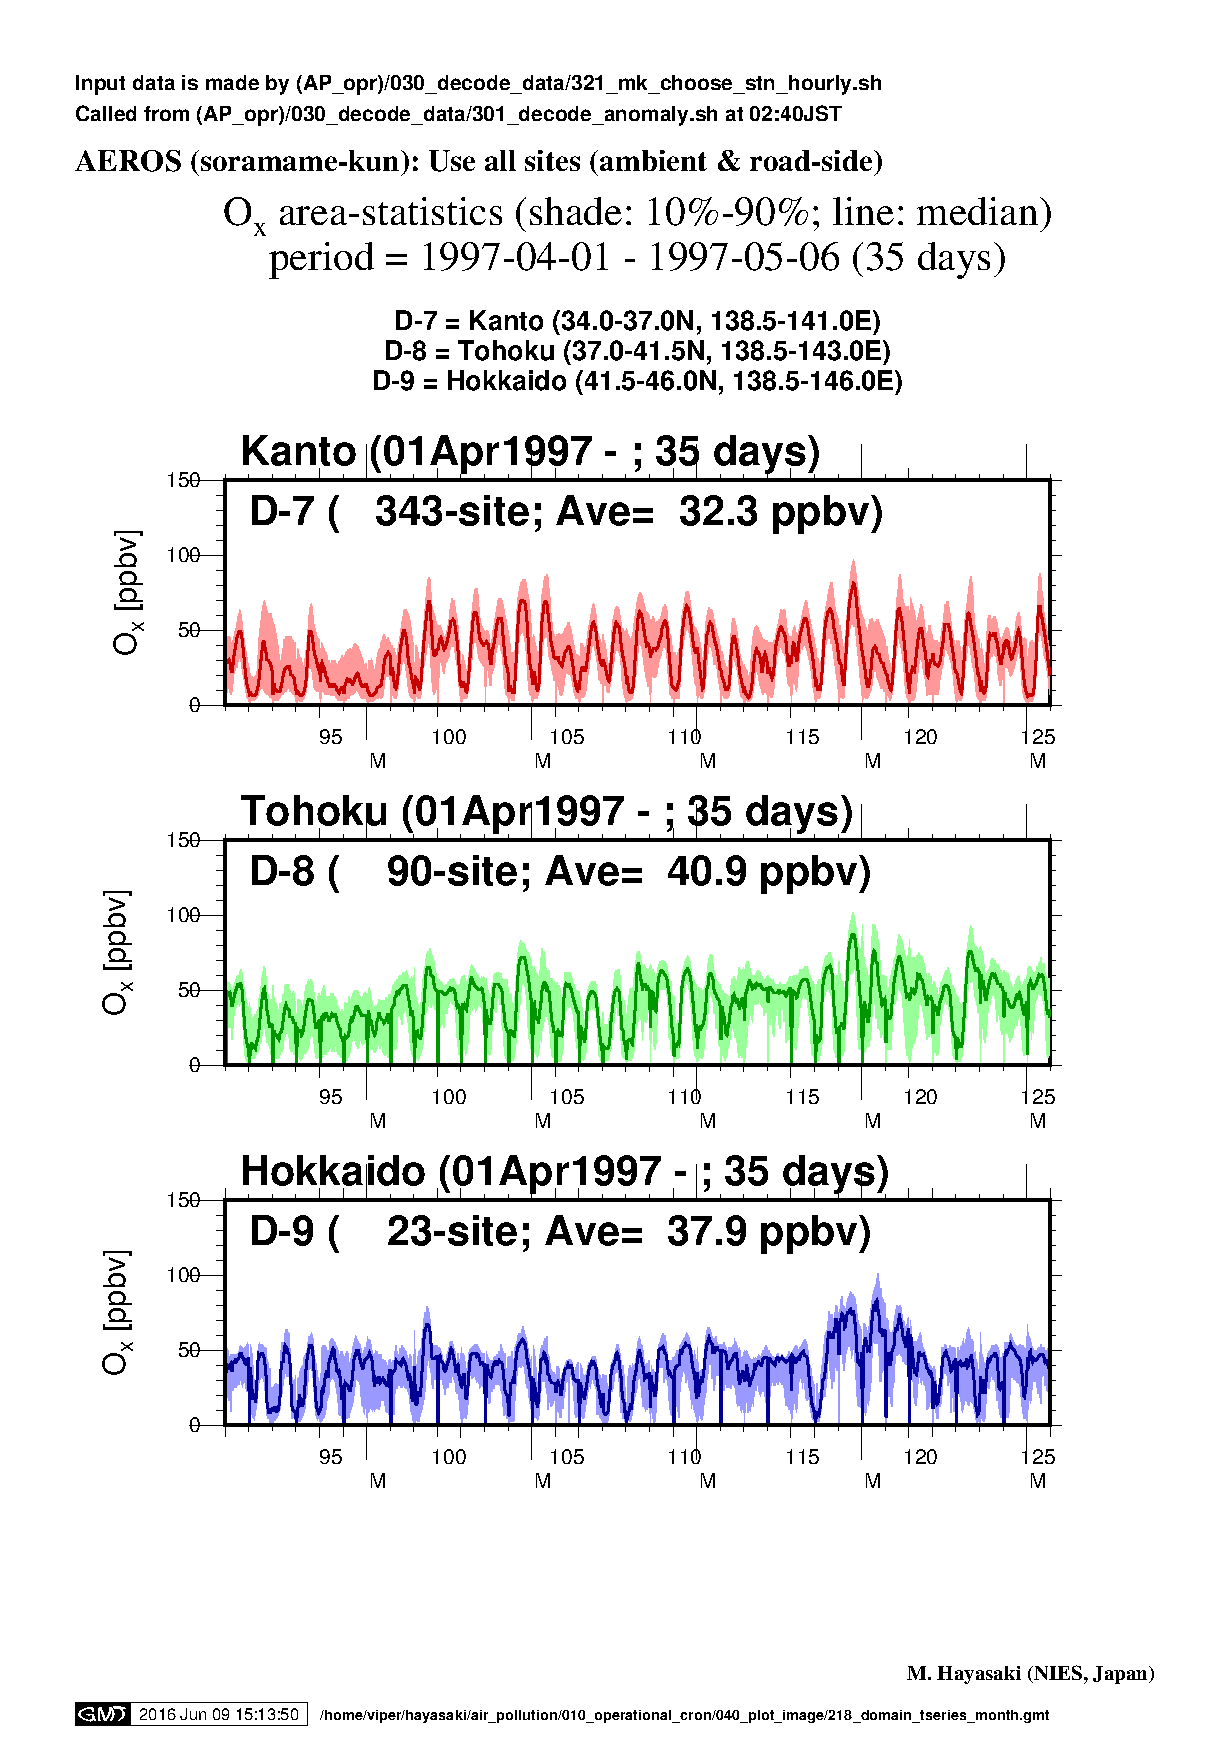
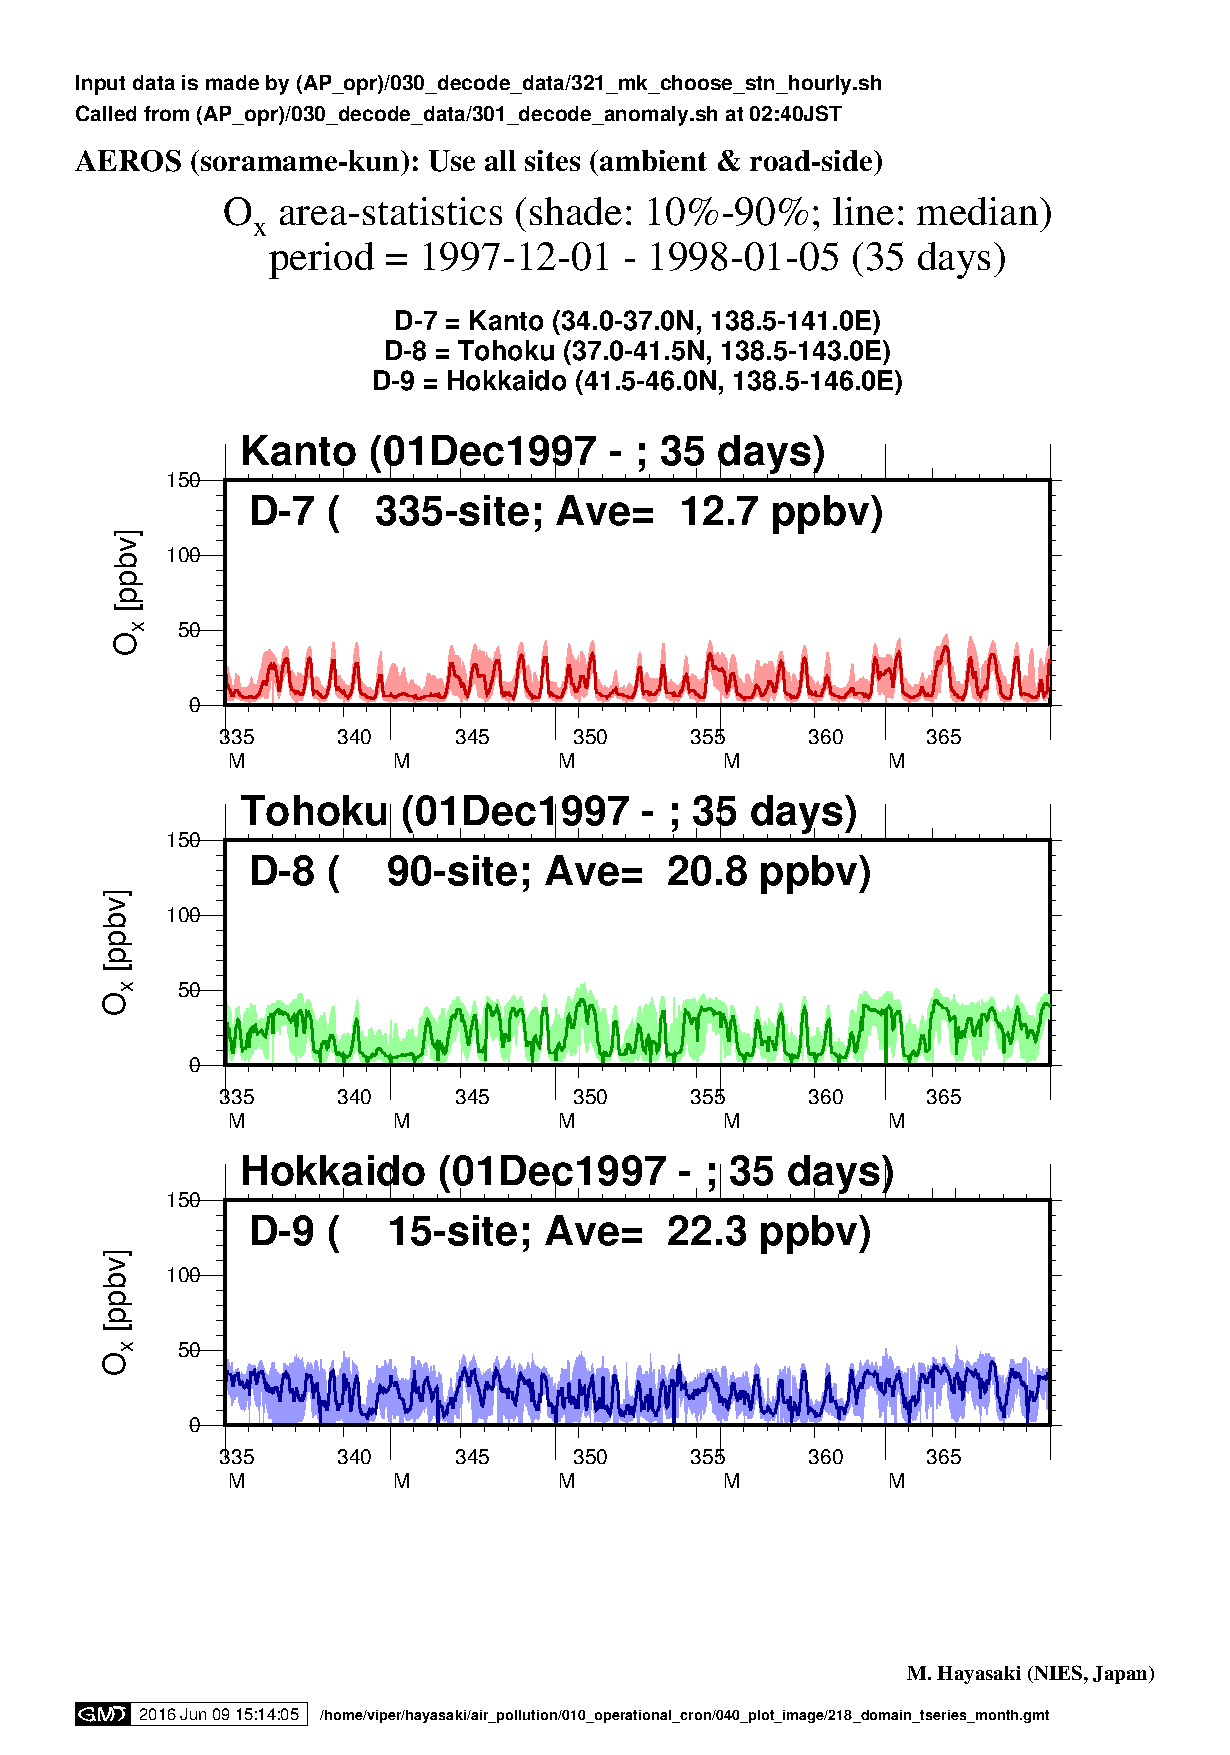
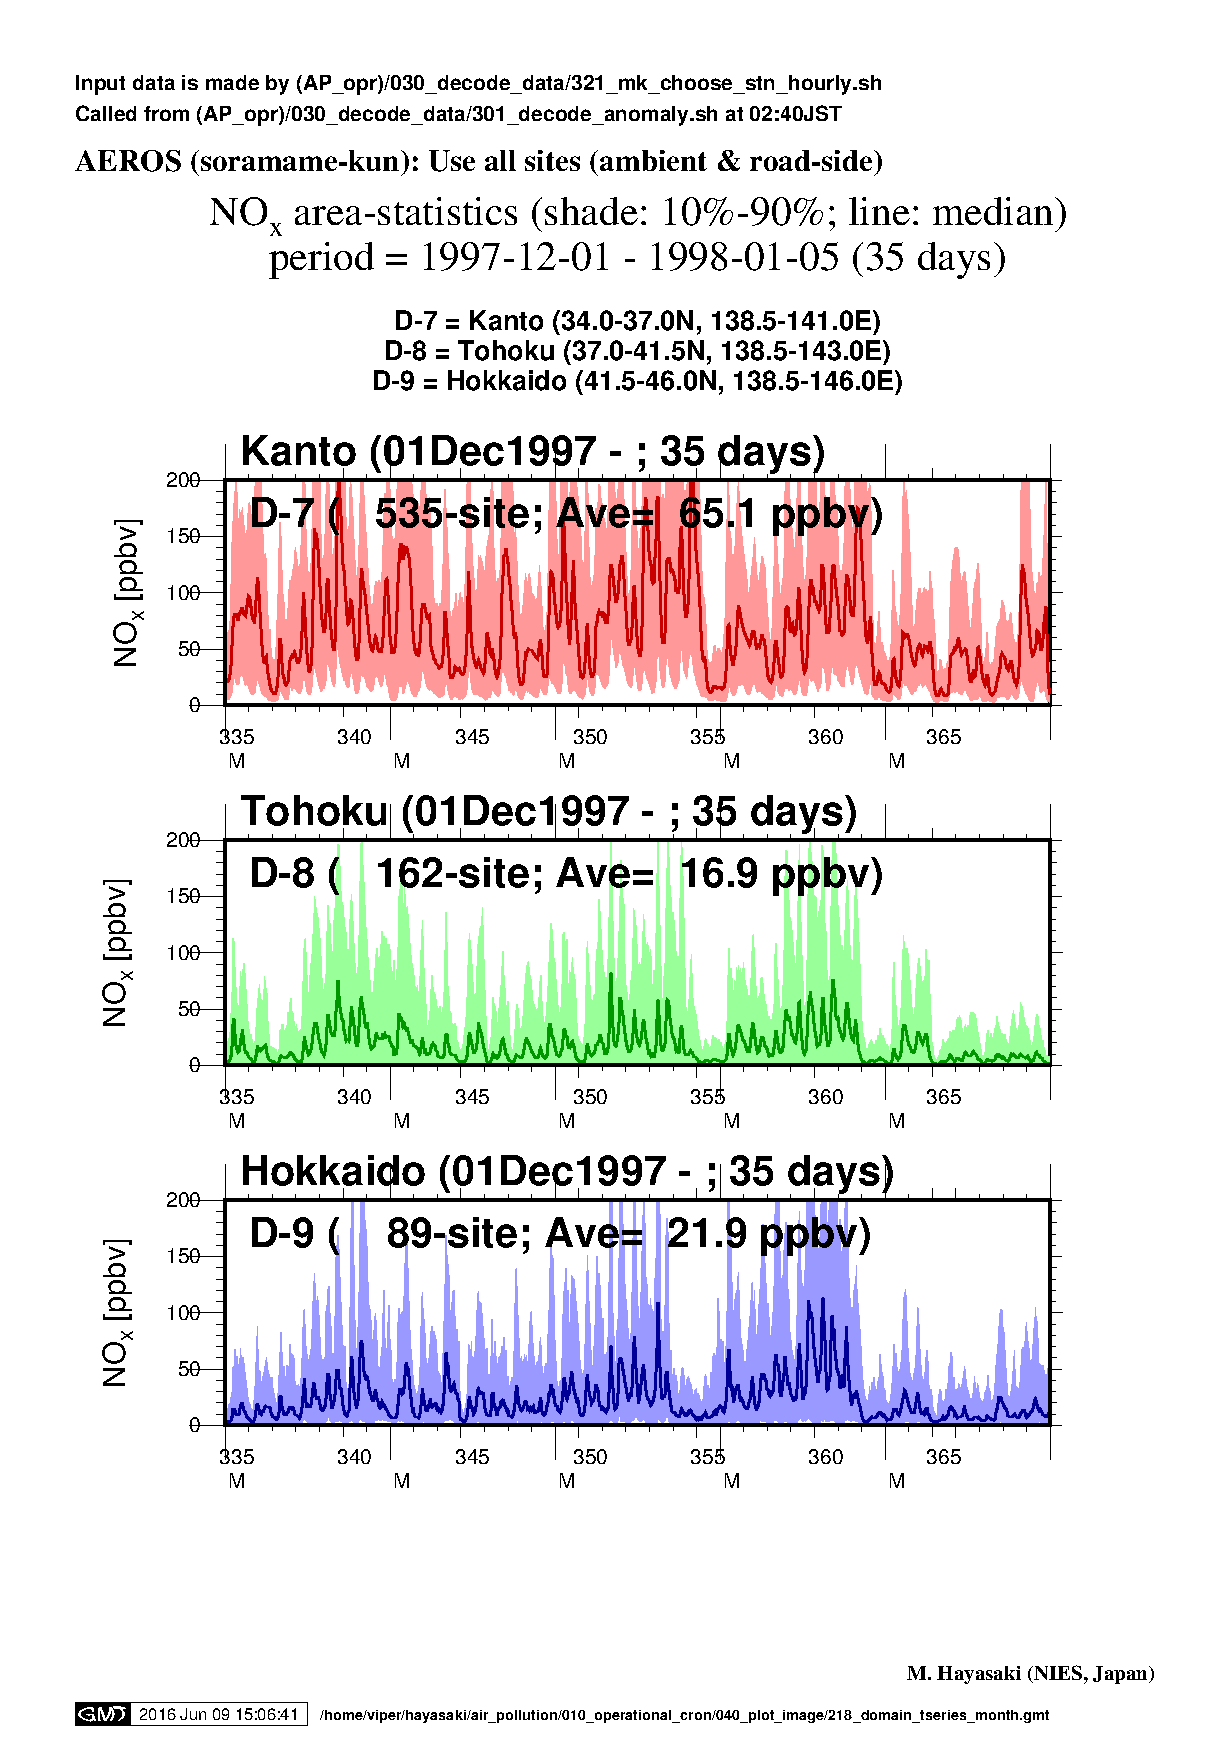
y1997: 関東,東北,北海道 (領域 7 - 9)
Jan, Feb, Mar, Apr, May, Jun, Jul, Aug, Sep, Oct, Nov, Dec,
| Month | Ox | SPM | PM2.5 | NOx |
|---|---|---|---|---|
| Jan1997 (D7 - 9) |
|
|
NA |
|
| Feb1997 (D7 - 9) |
|
|
NA |
|
| Mar1997 (D7 - 9) |
|
|
NA |
|
| Month | Ox | SPM | PM2.5 | NOx |
| Apr1997 (D7 - 9) |
|

|
NA |

|
| May1997 (D7 - 9) |

|
|
NA |
|
| Jun1997 (D7 - 9) |
|
|
NA |
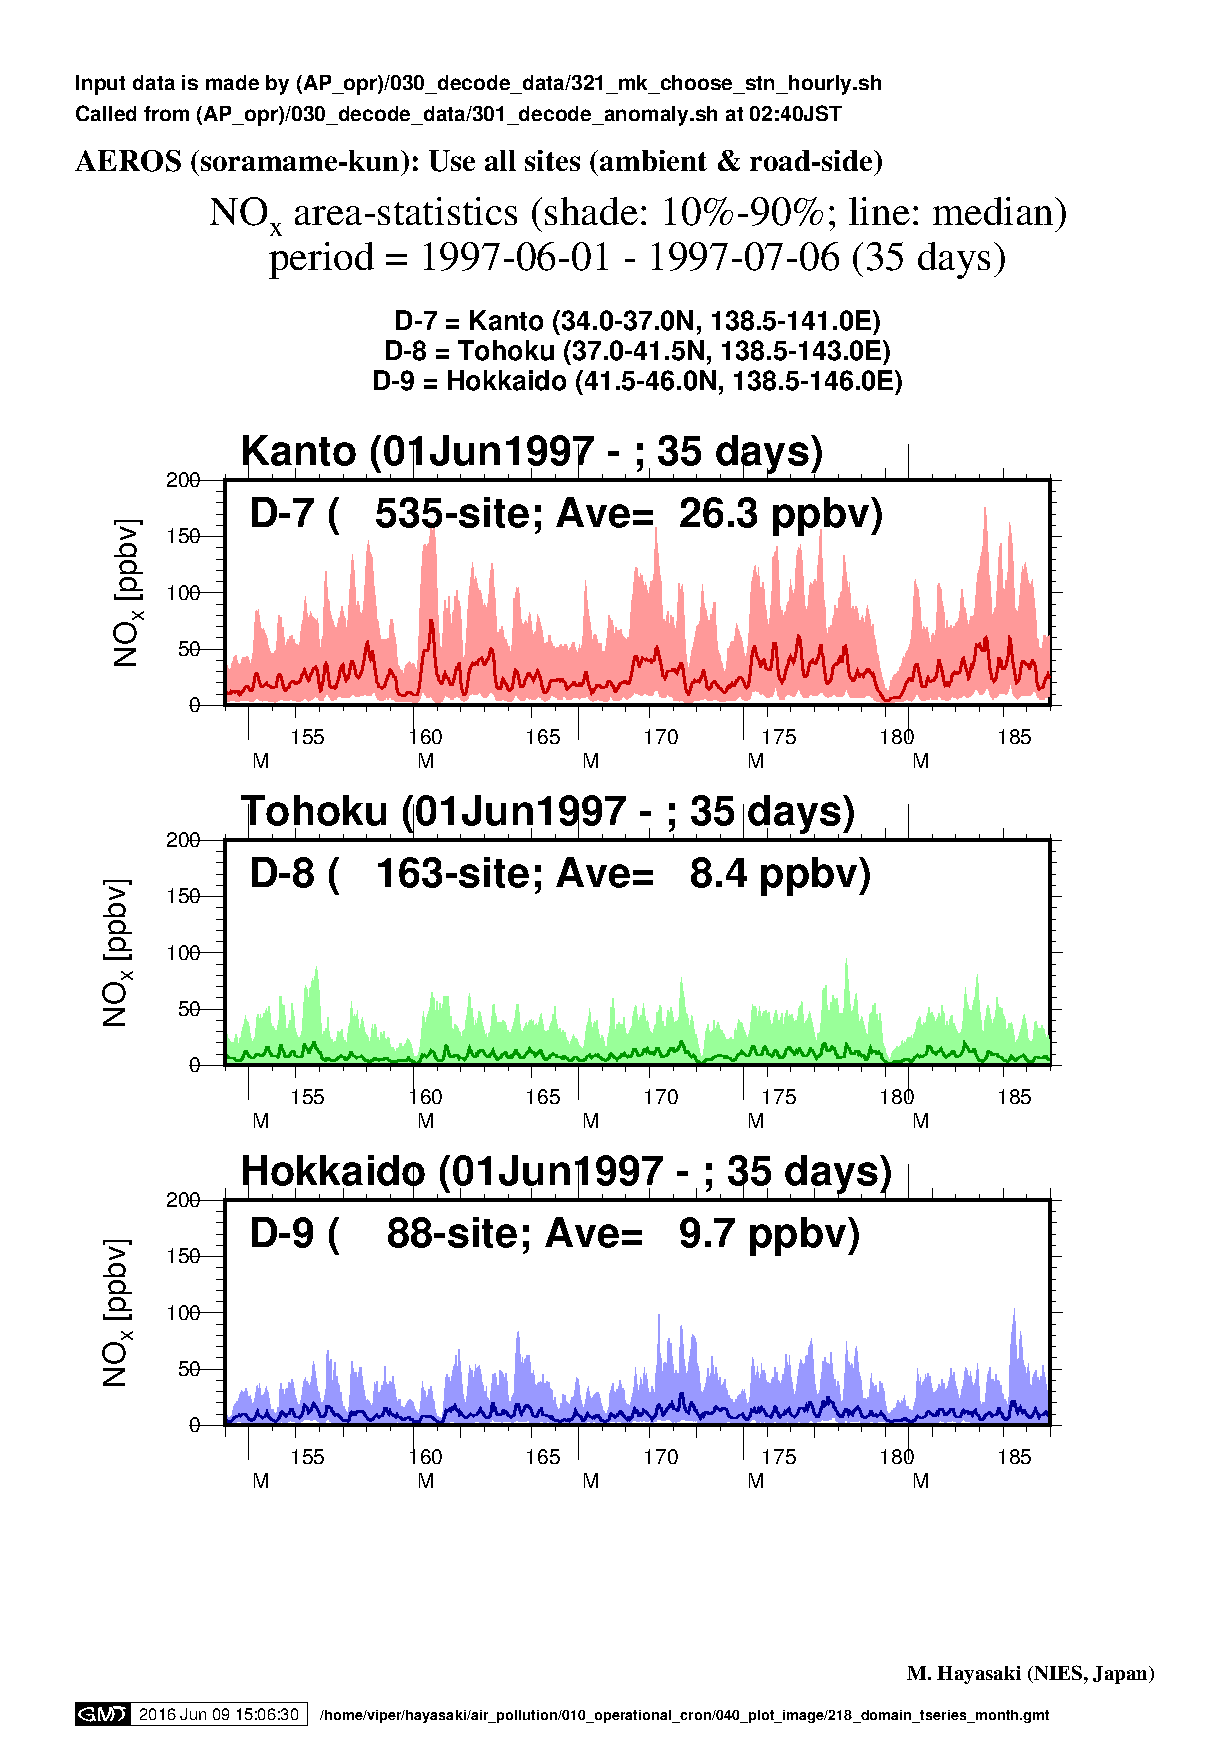
|
| Month | Ox | SPM | PM2.5 | NOx |
| Jul1997 (D7 - 9) |
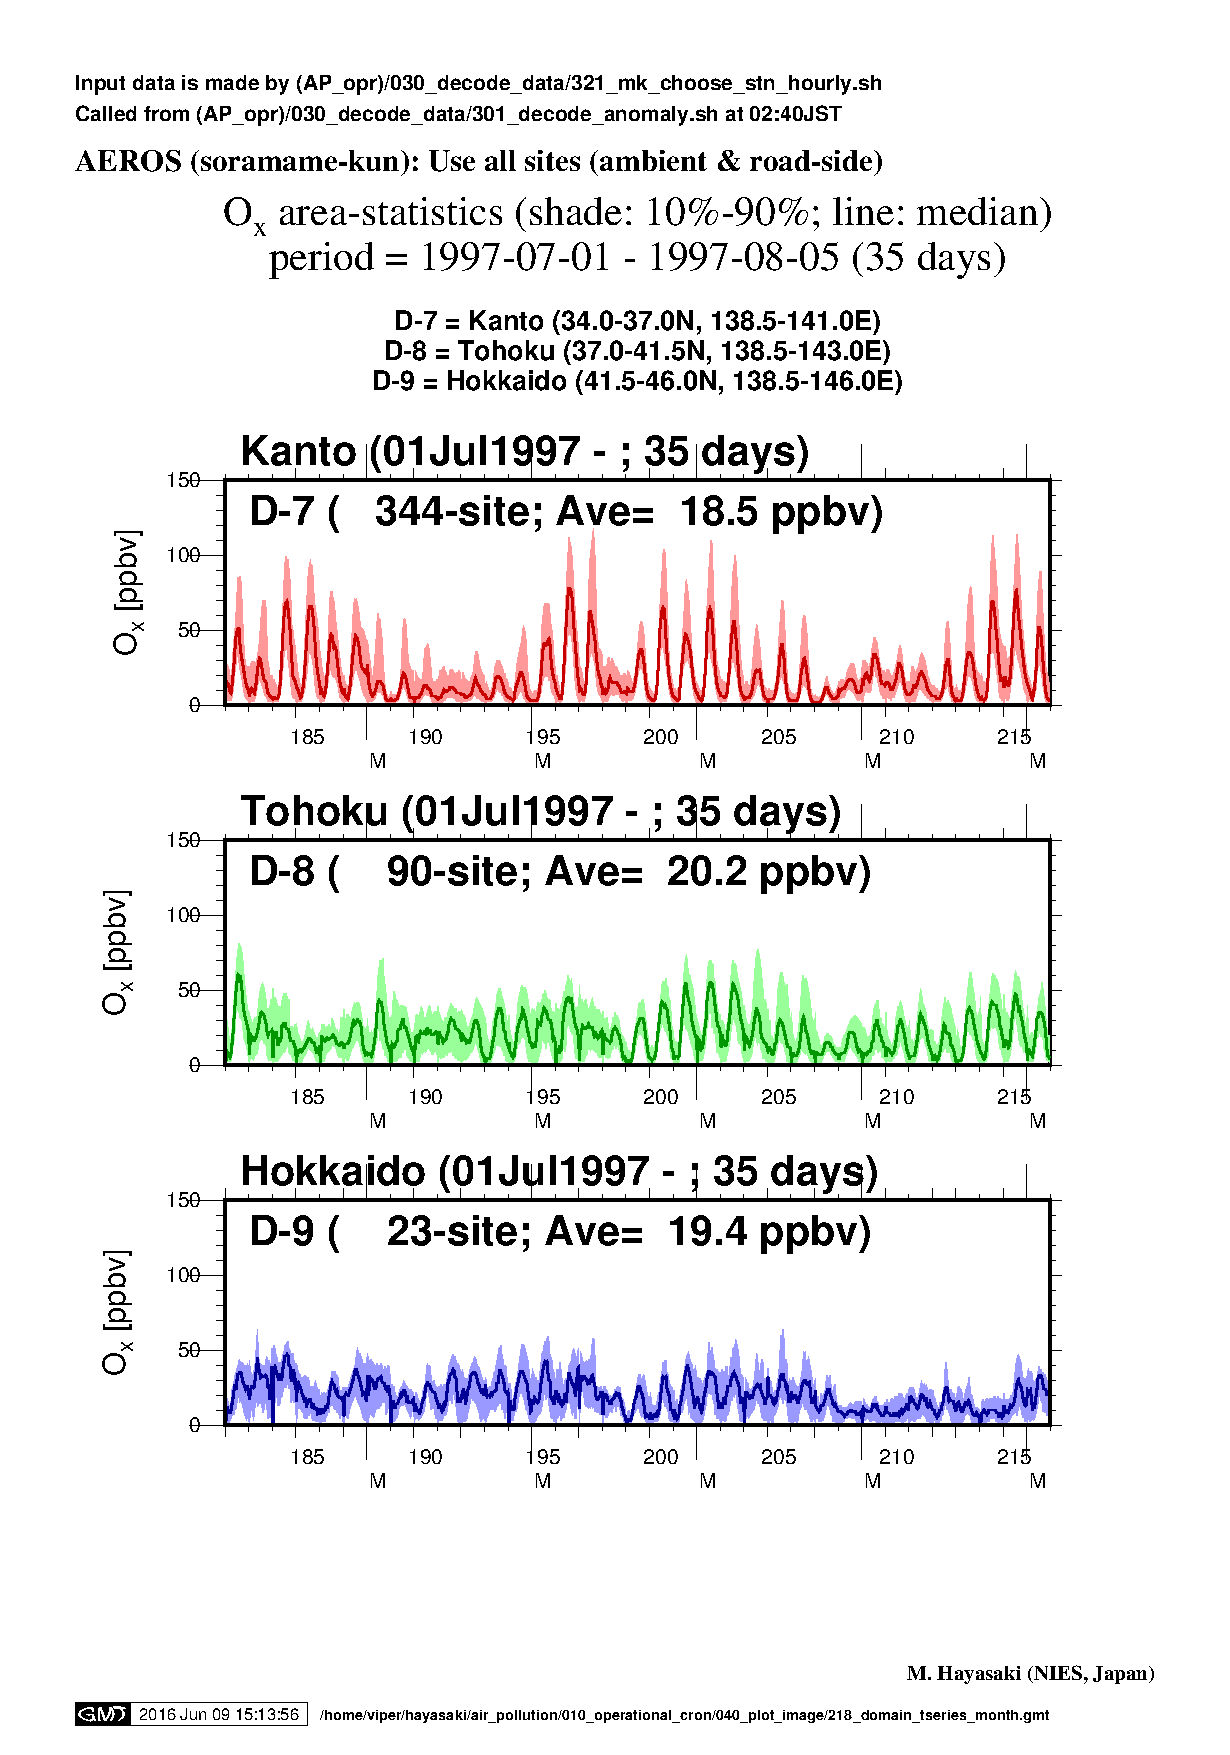
|
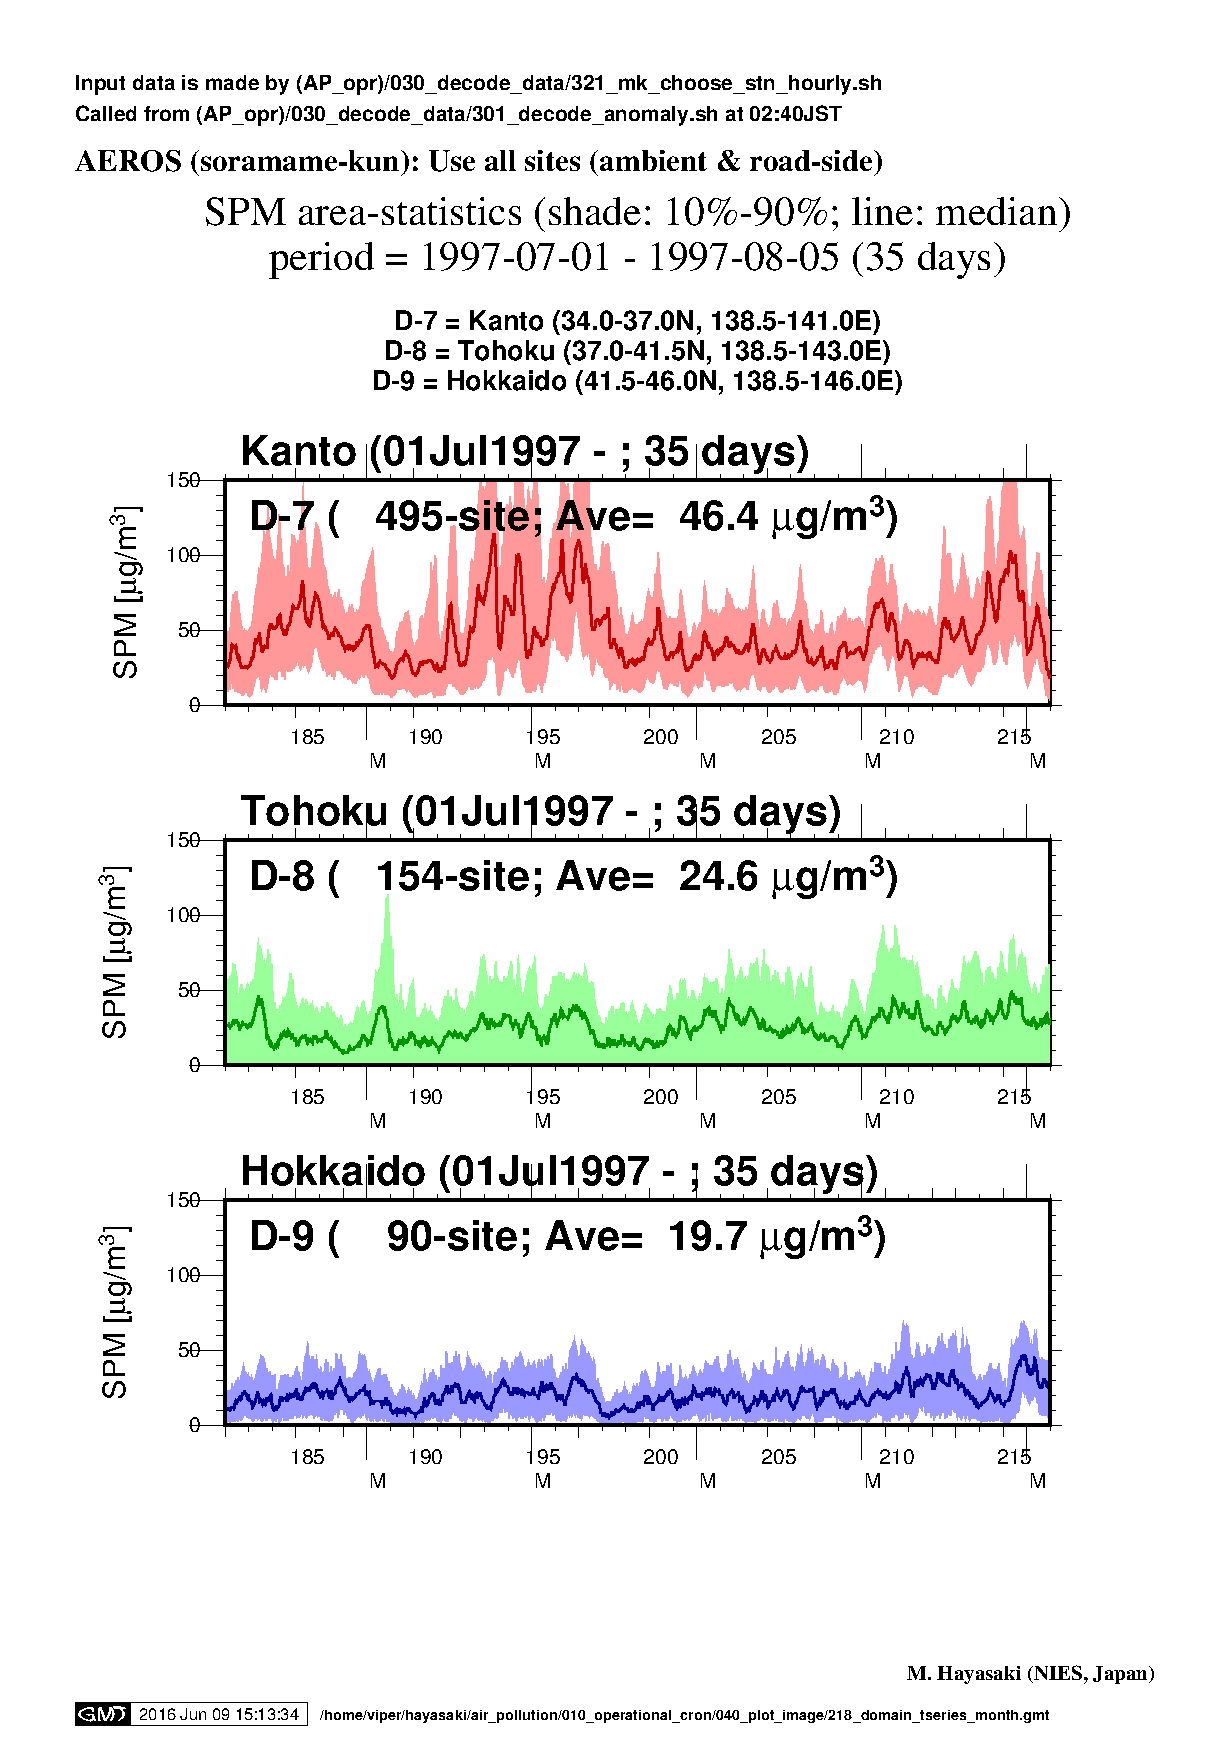
|
NA |

|
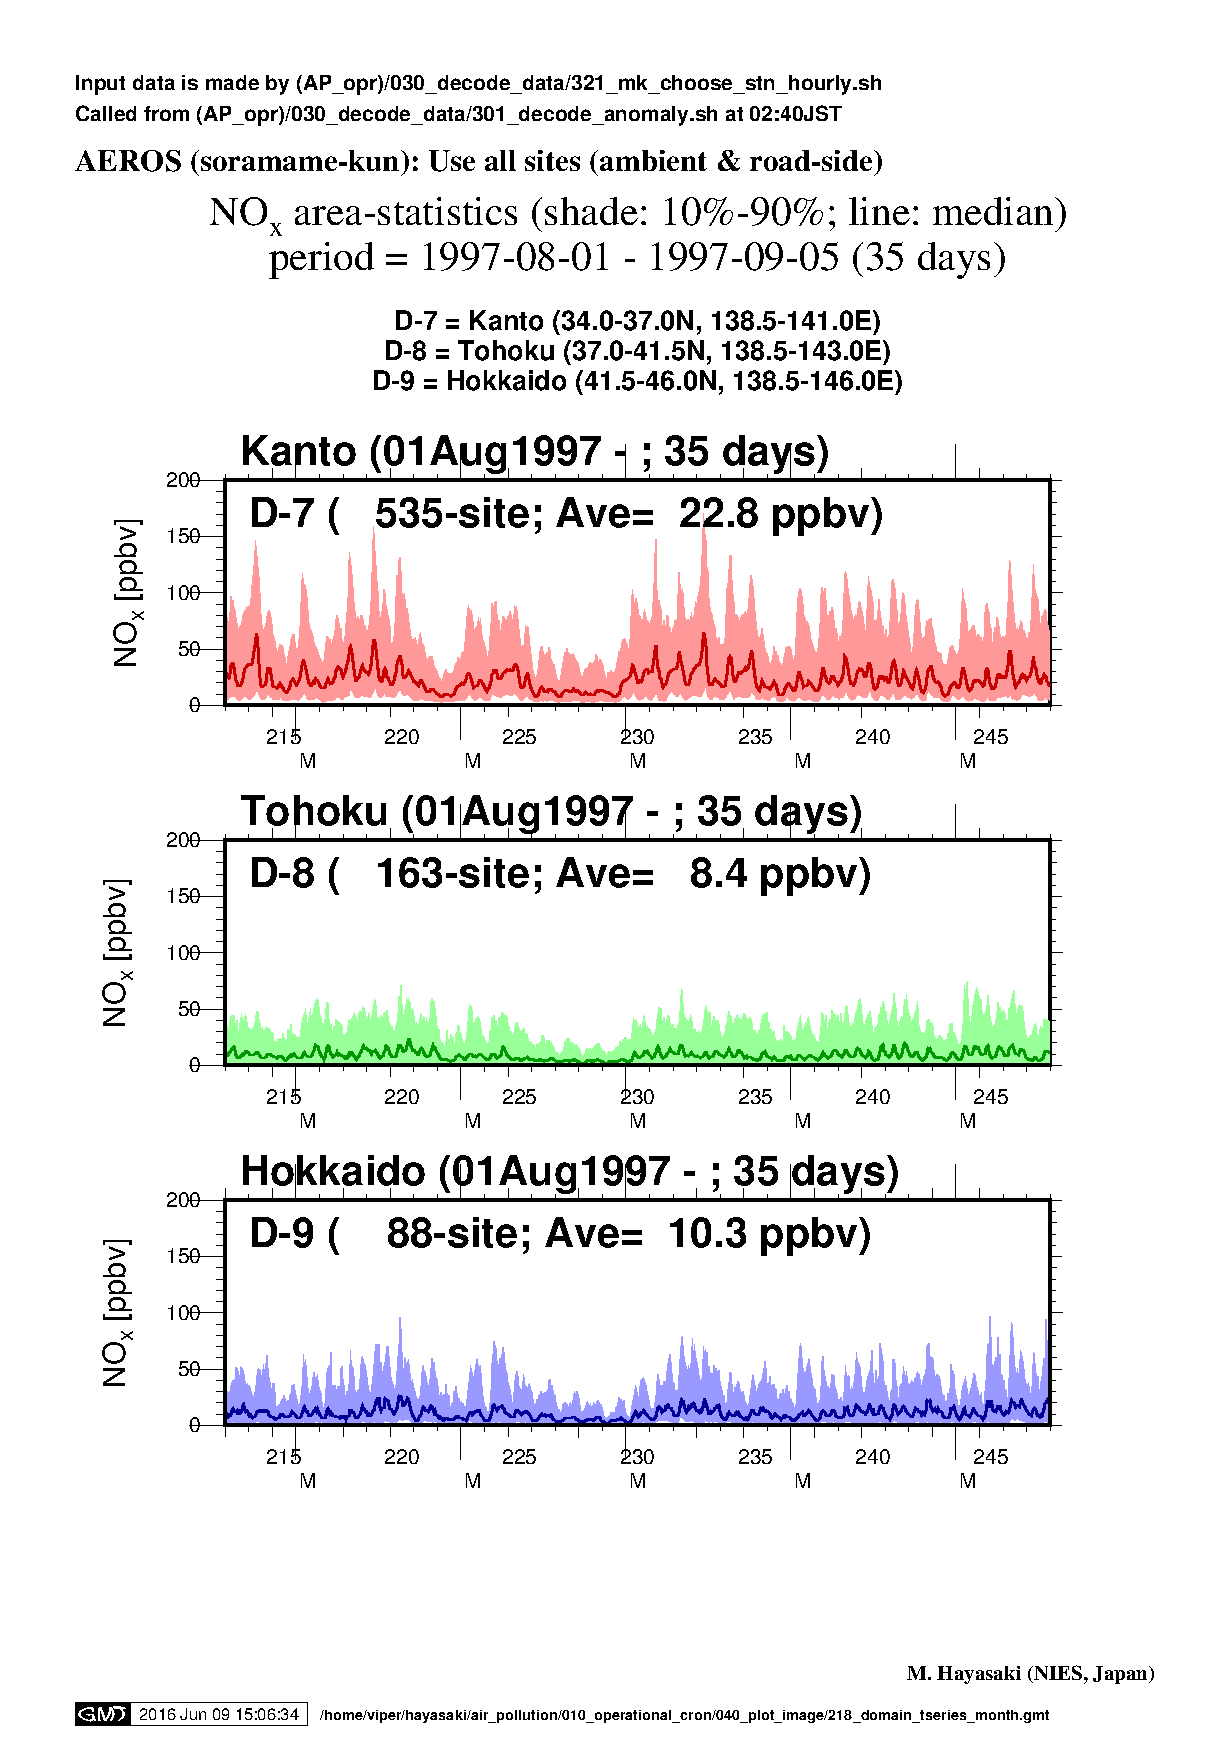
| Aug1997 (D7 - 9) |
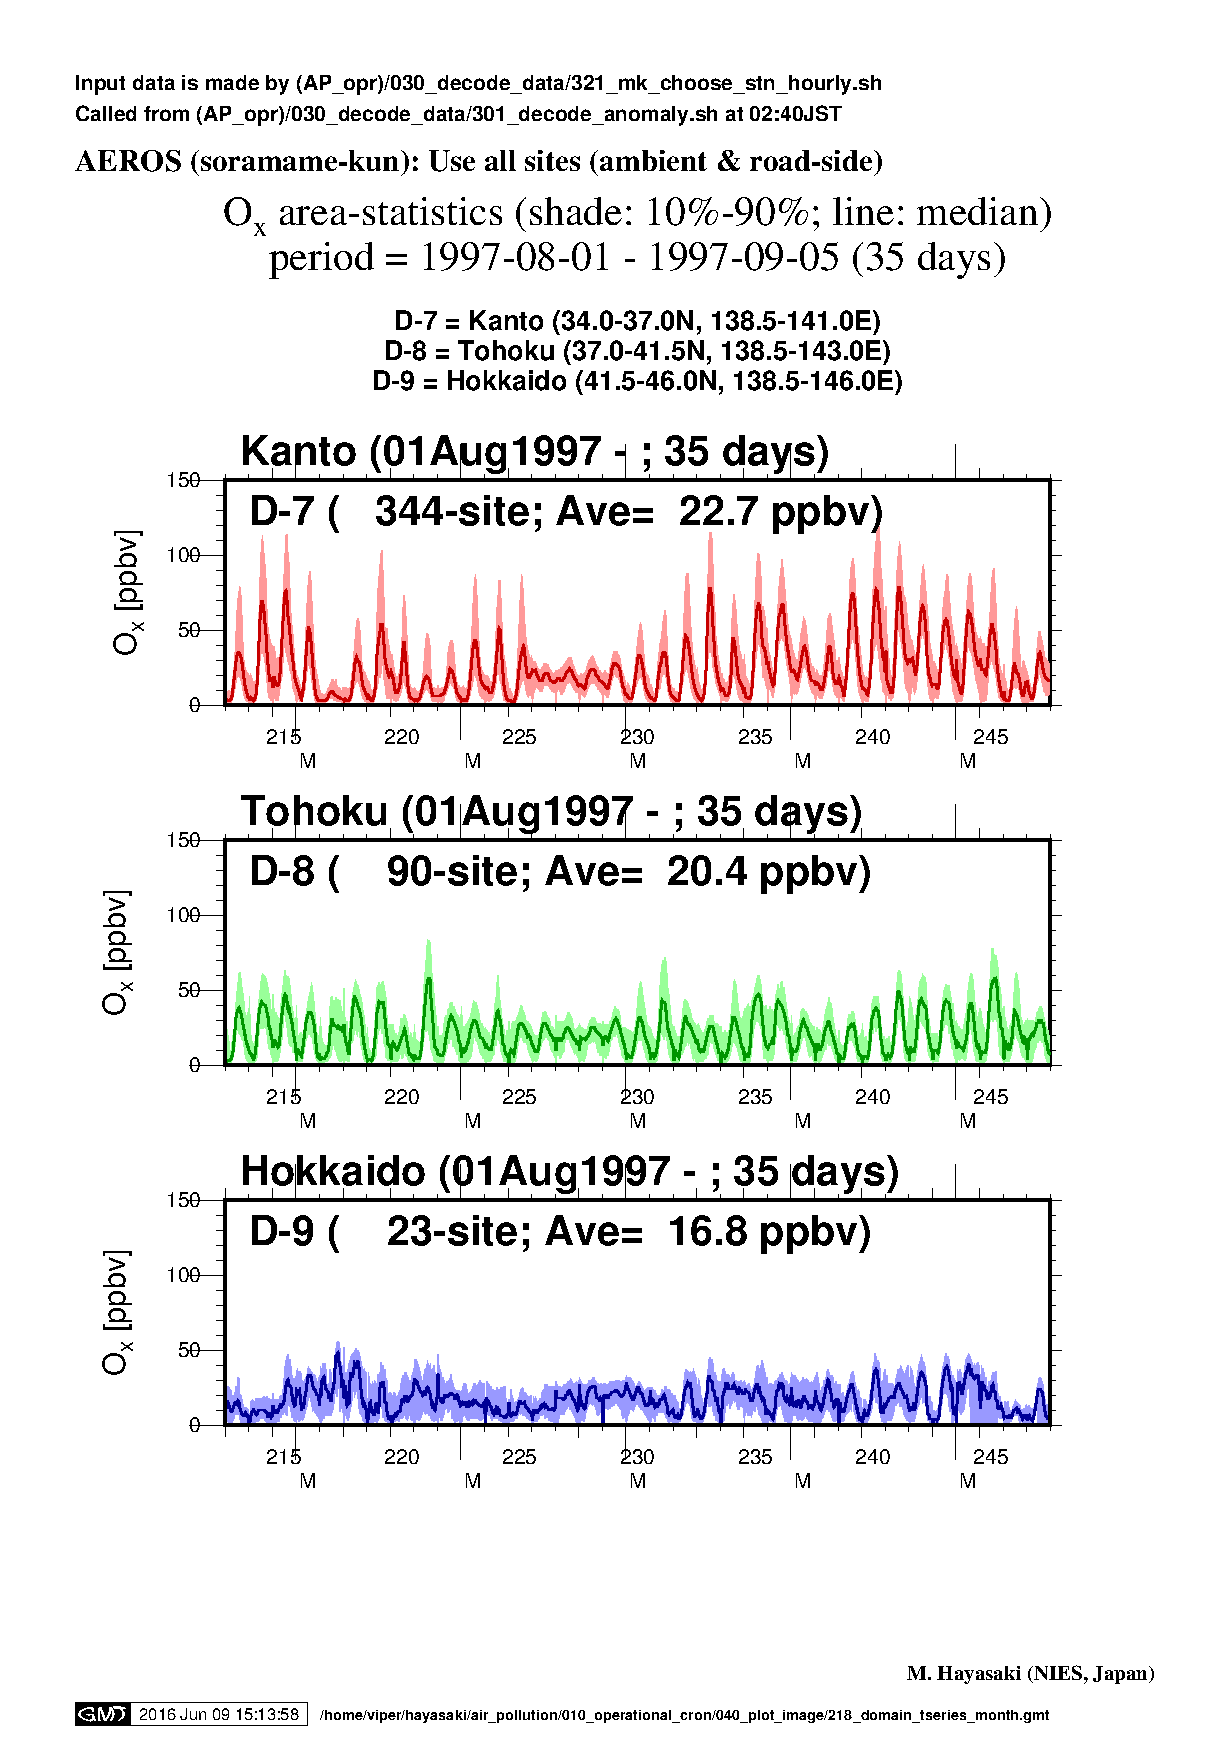
|
|
NA |
|
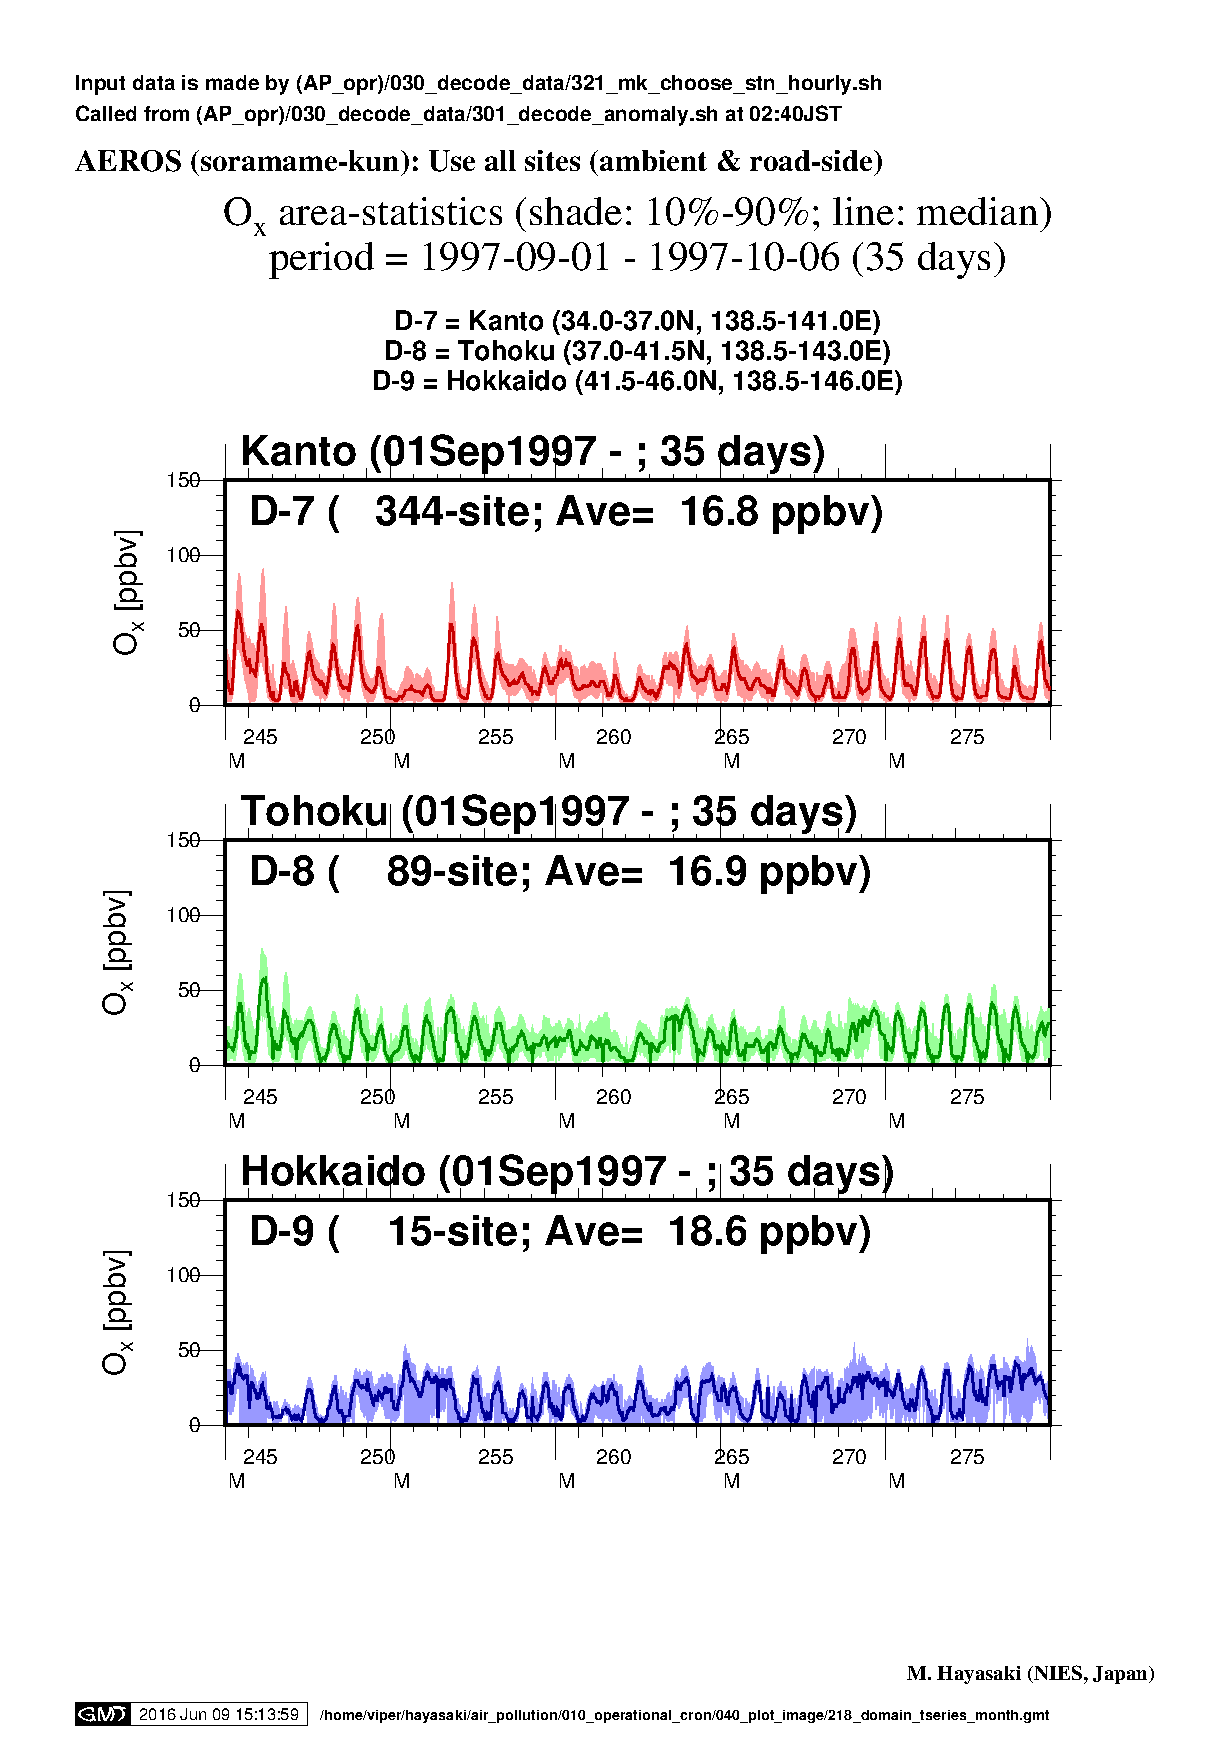
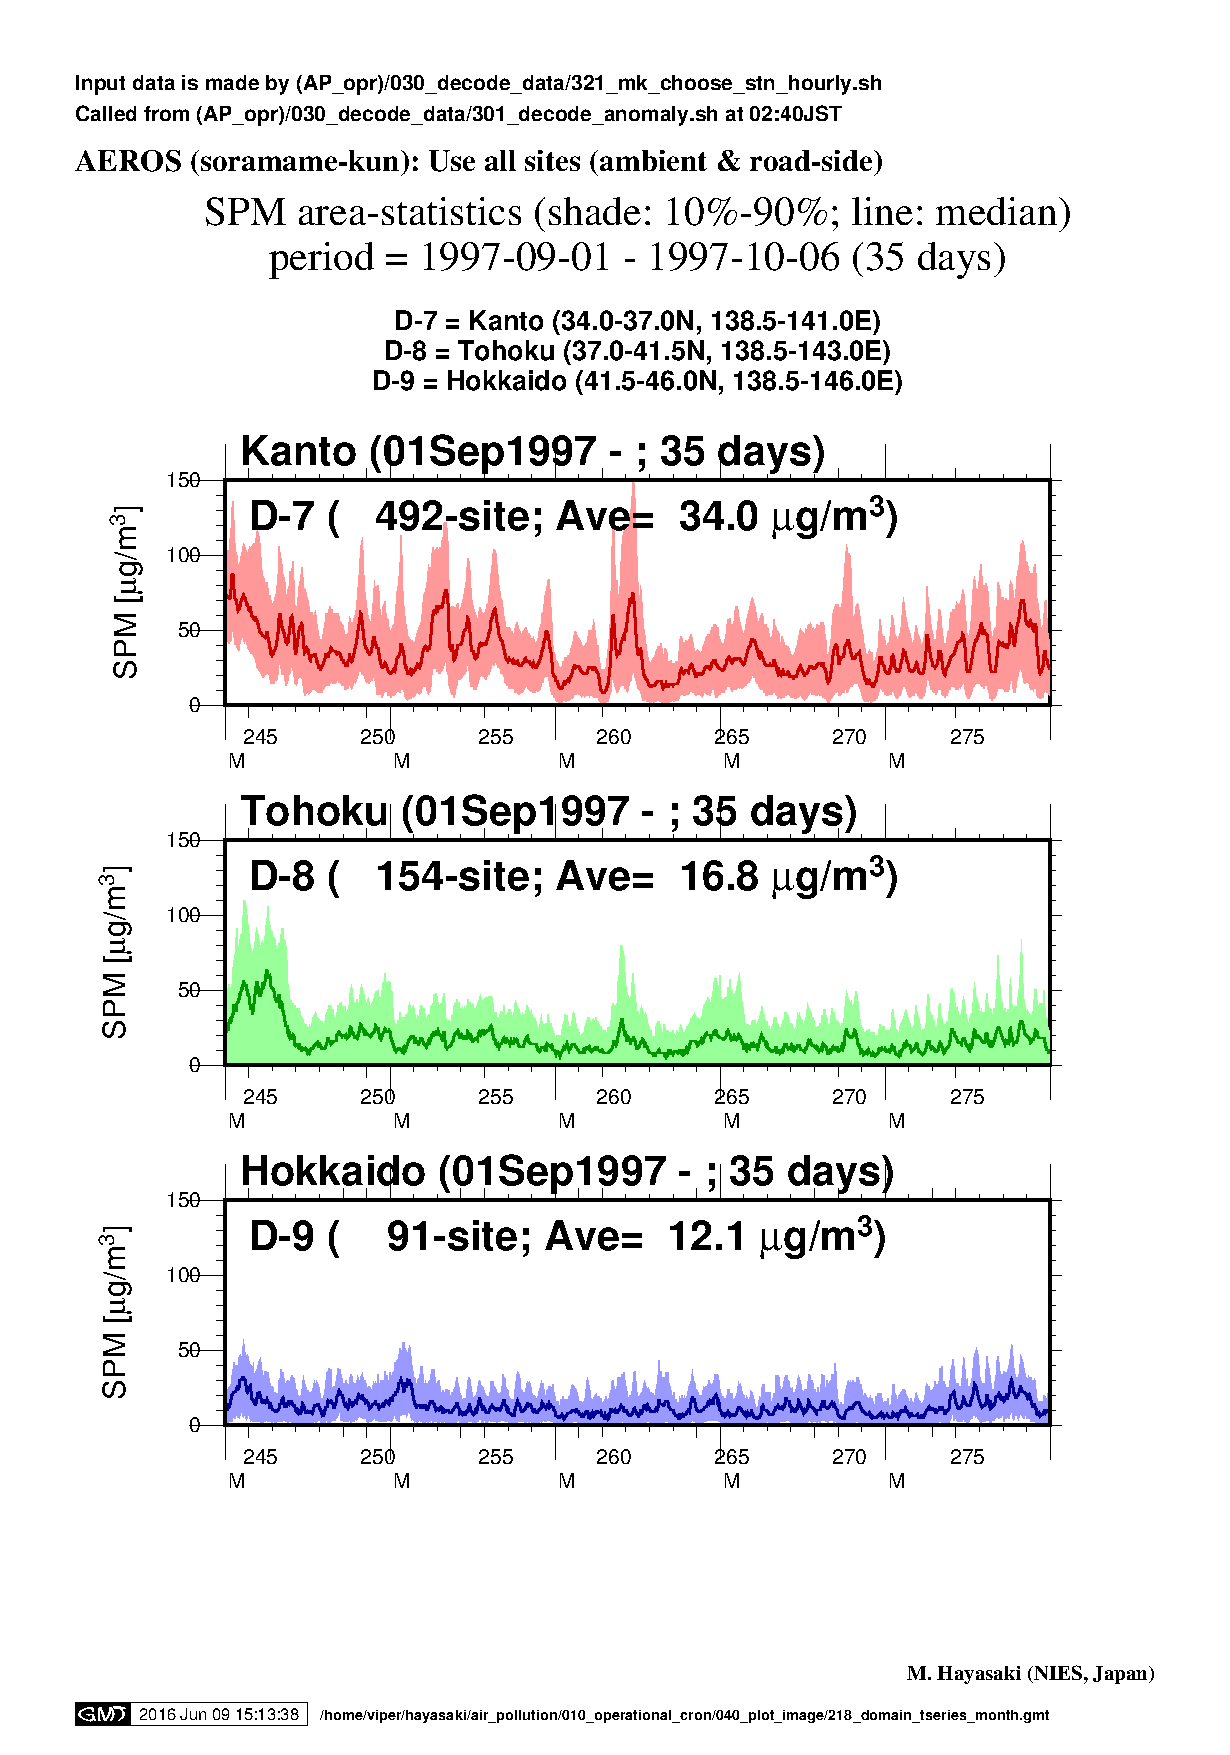
| Sep1997 (D7 - 9) |
|
|
NA |
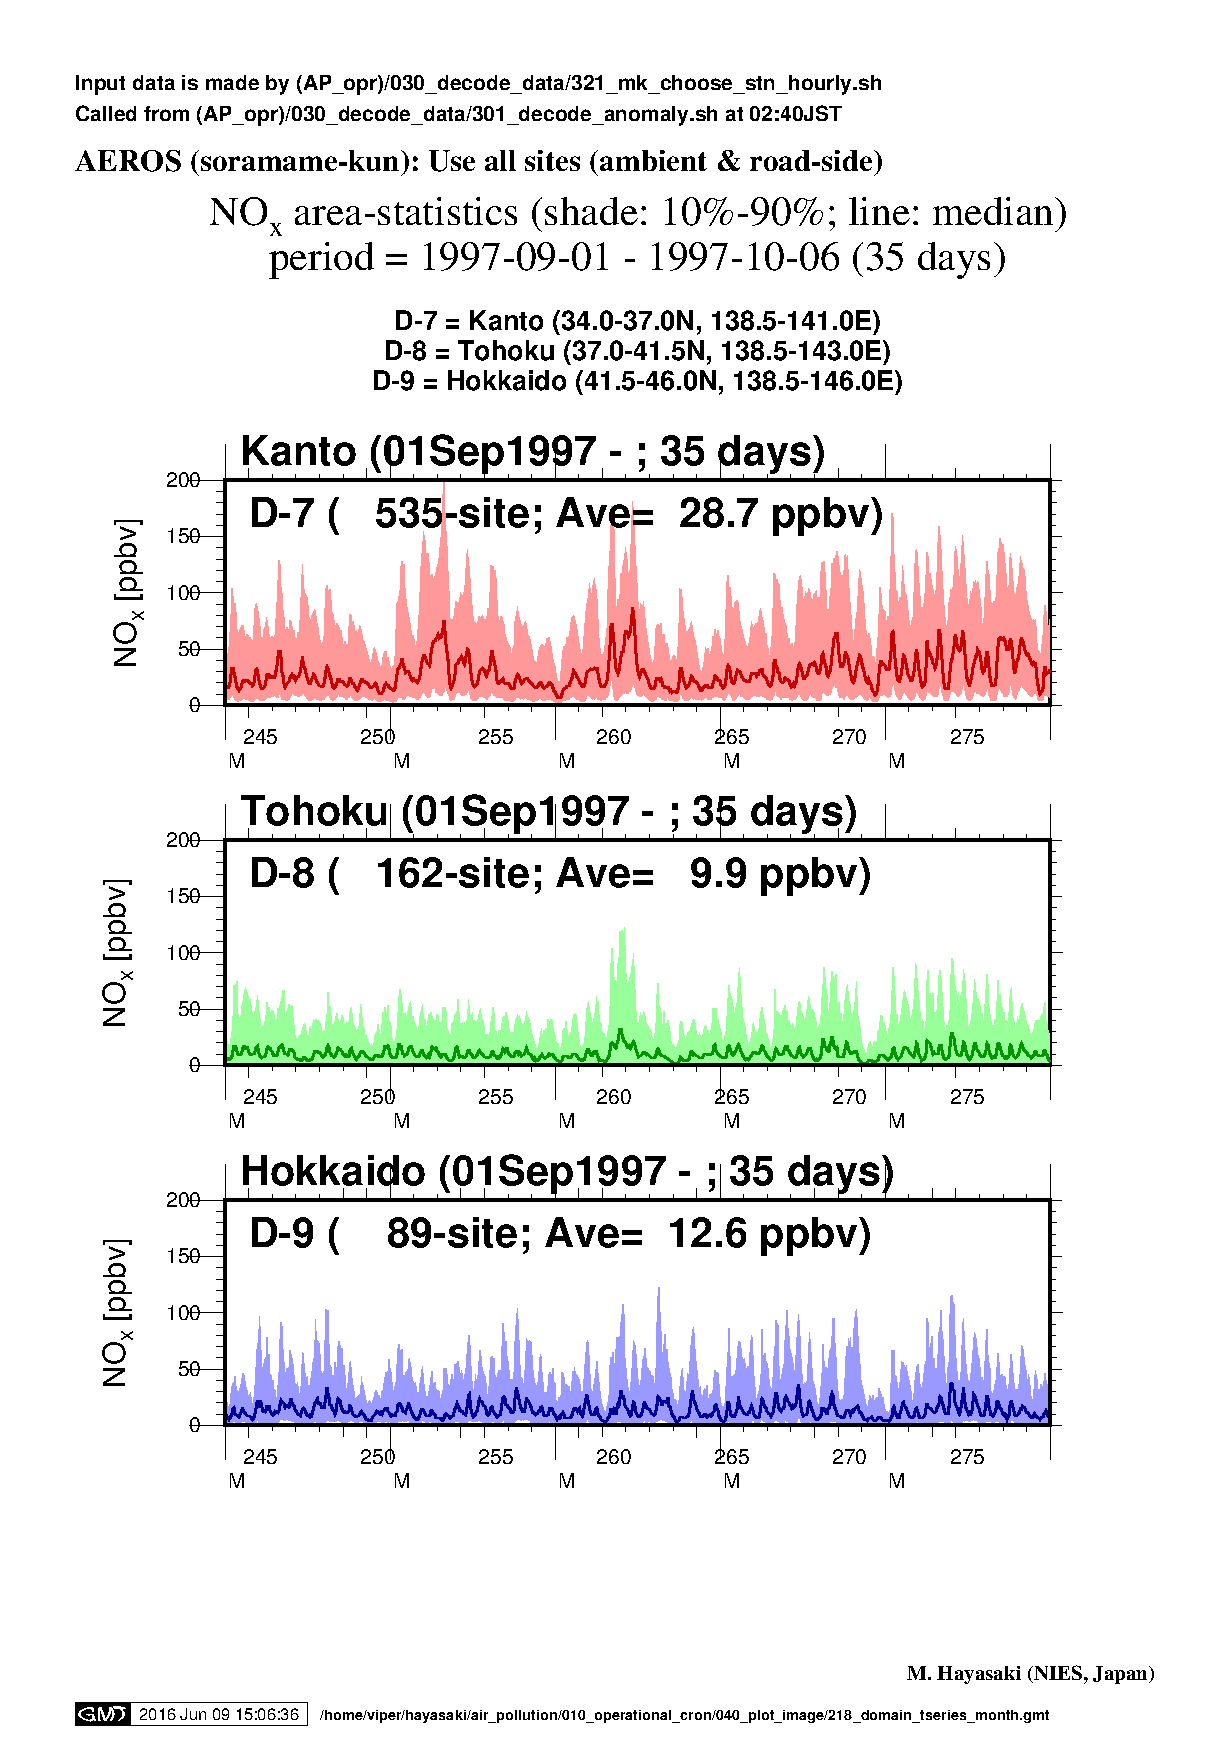
|
| Month | Ox | SPM | PM2.5 | NOx |
| Oct1997 (D7 - 9) |

|
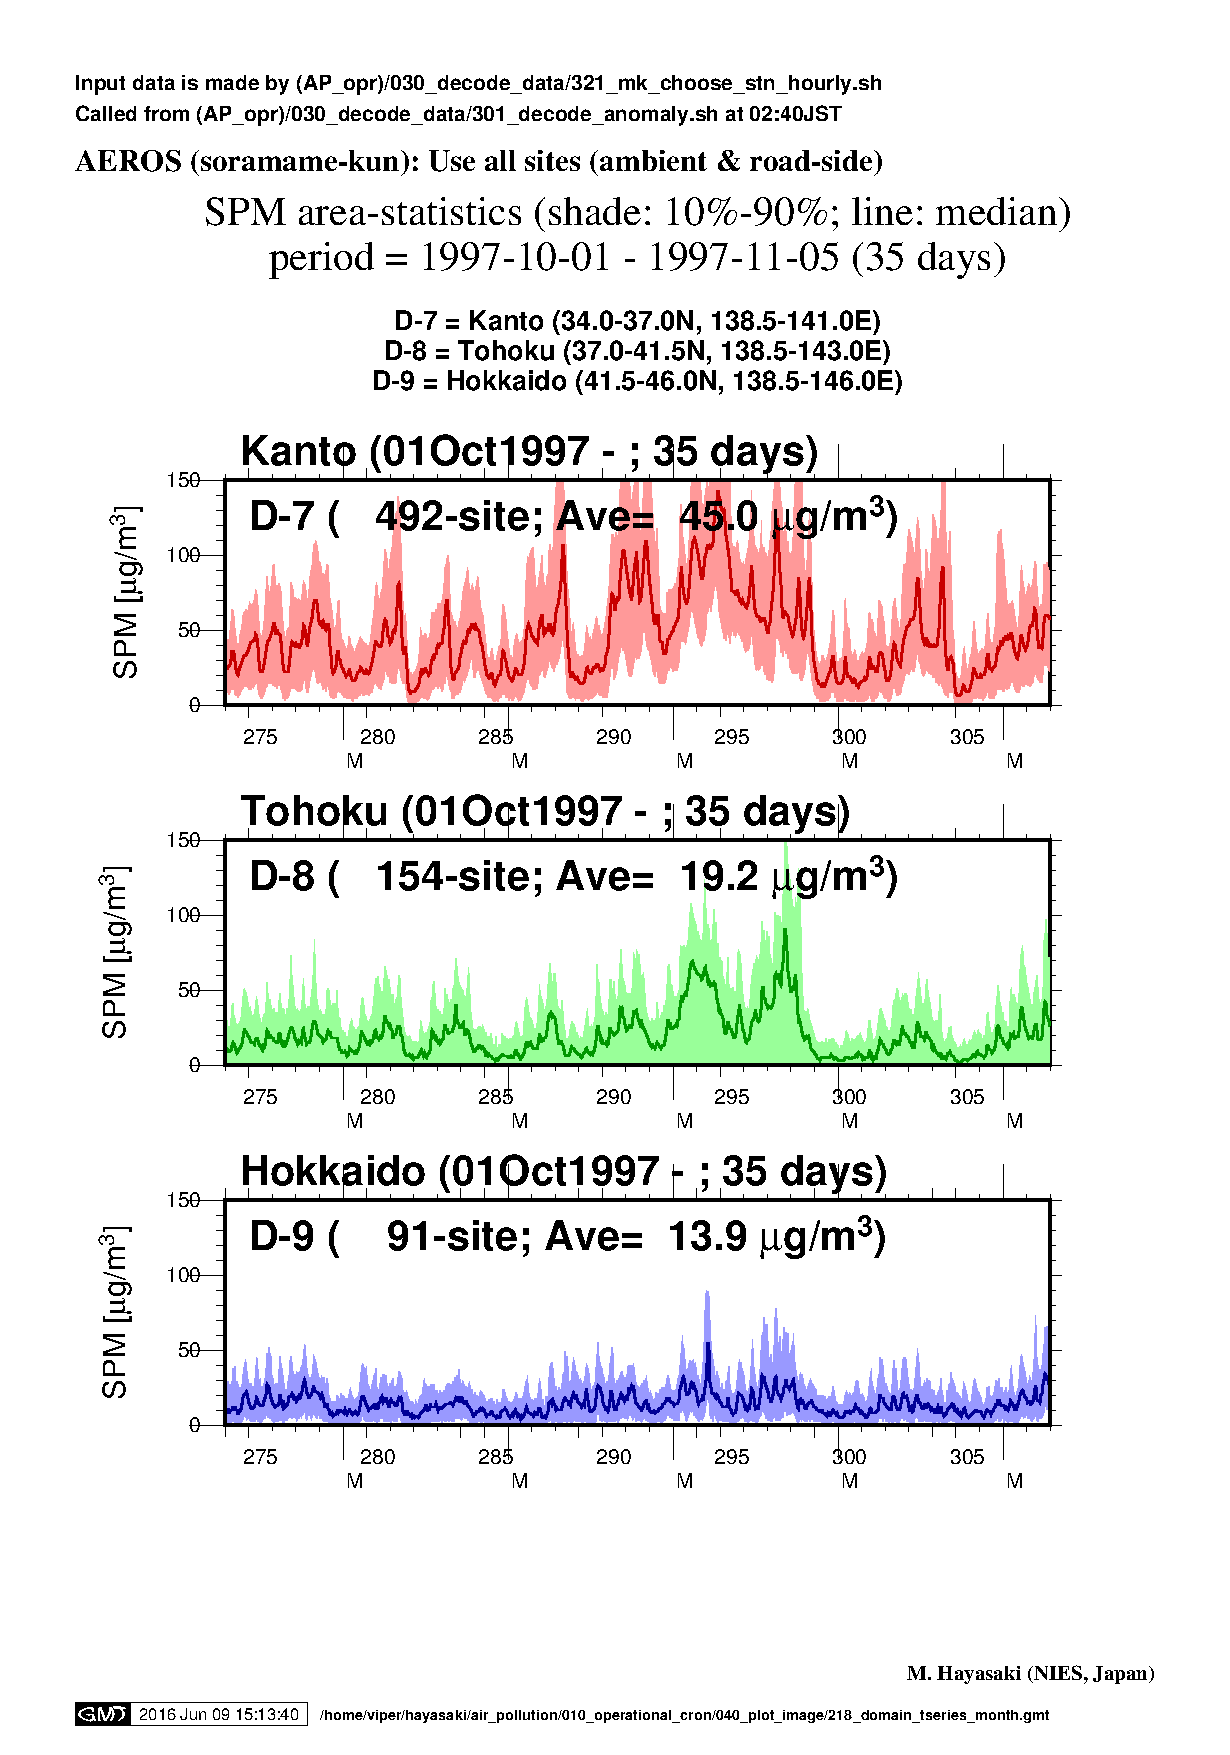
|
NA |

|
| Nov1997 (D7 - 9) |
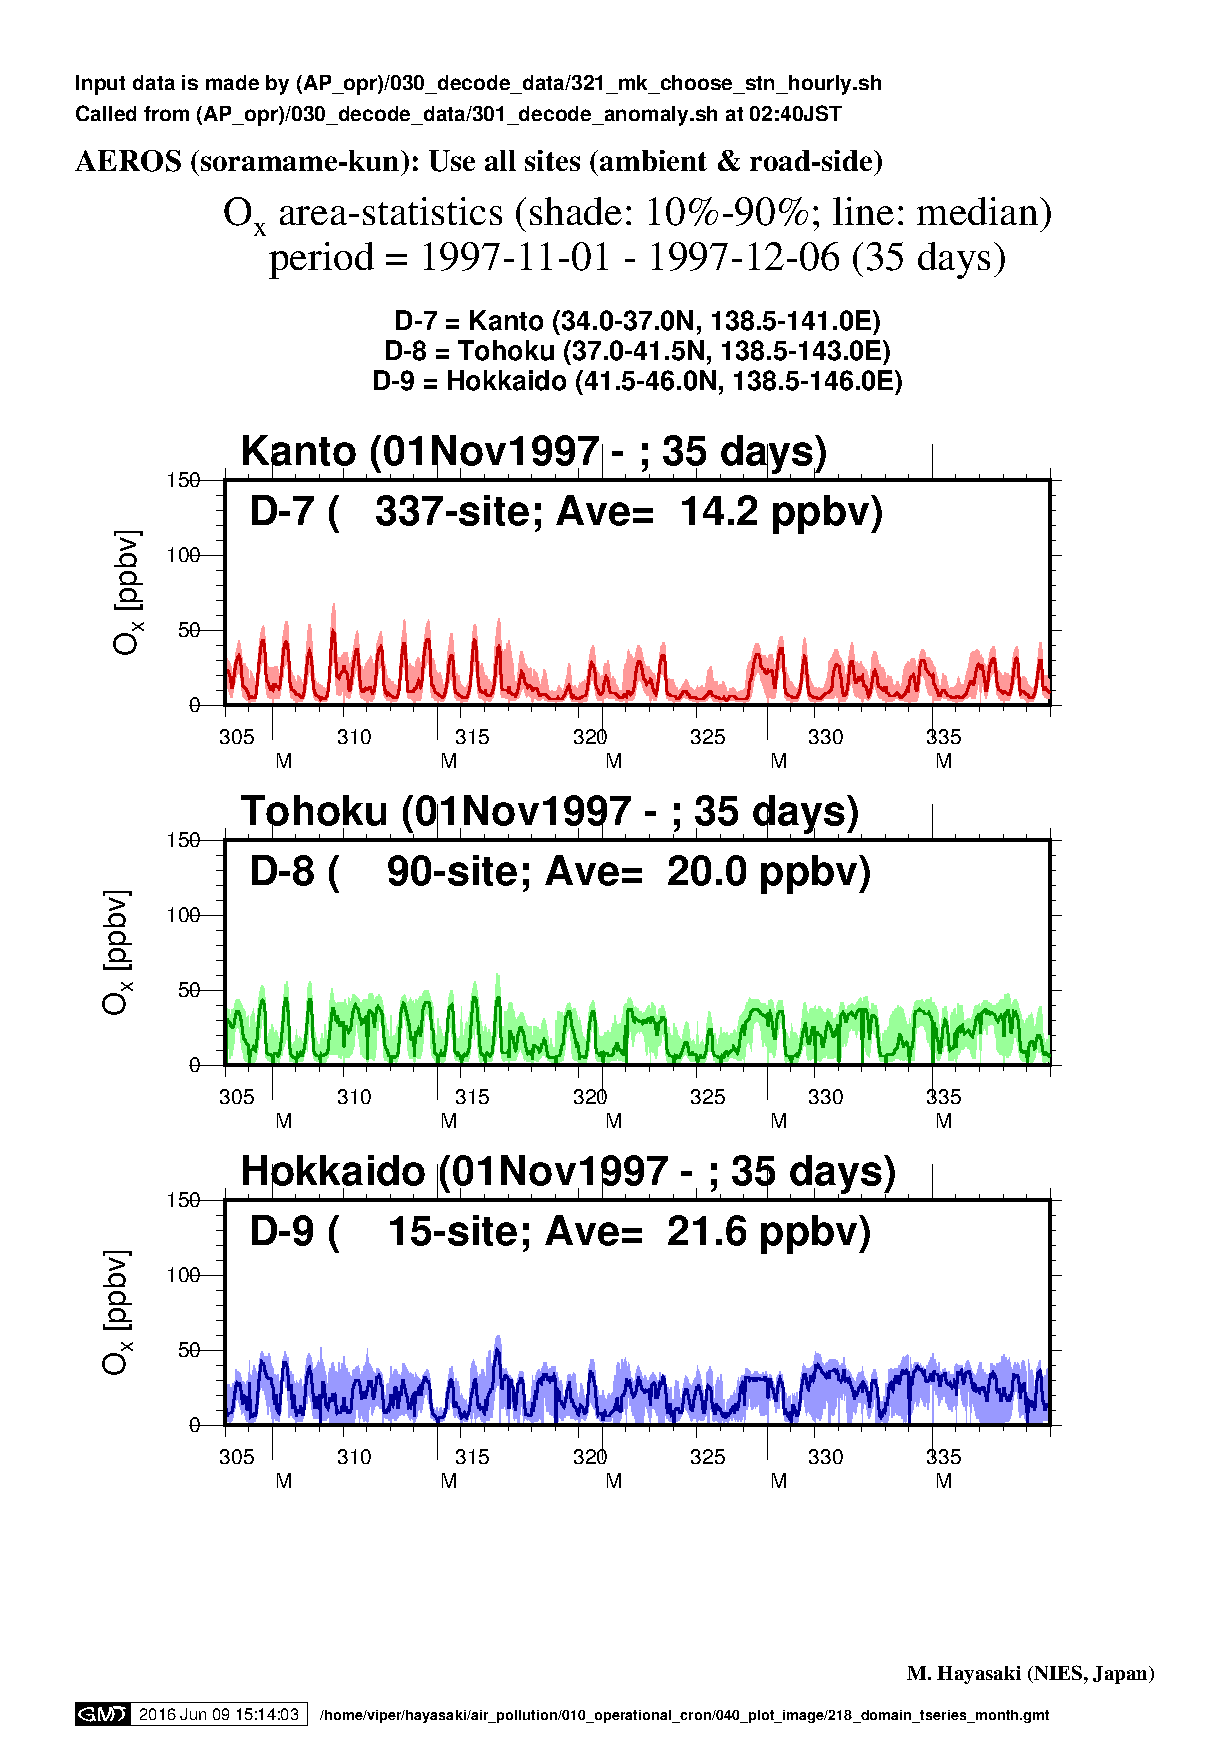
|

|
NA |
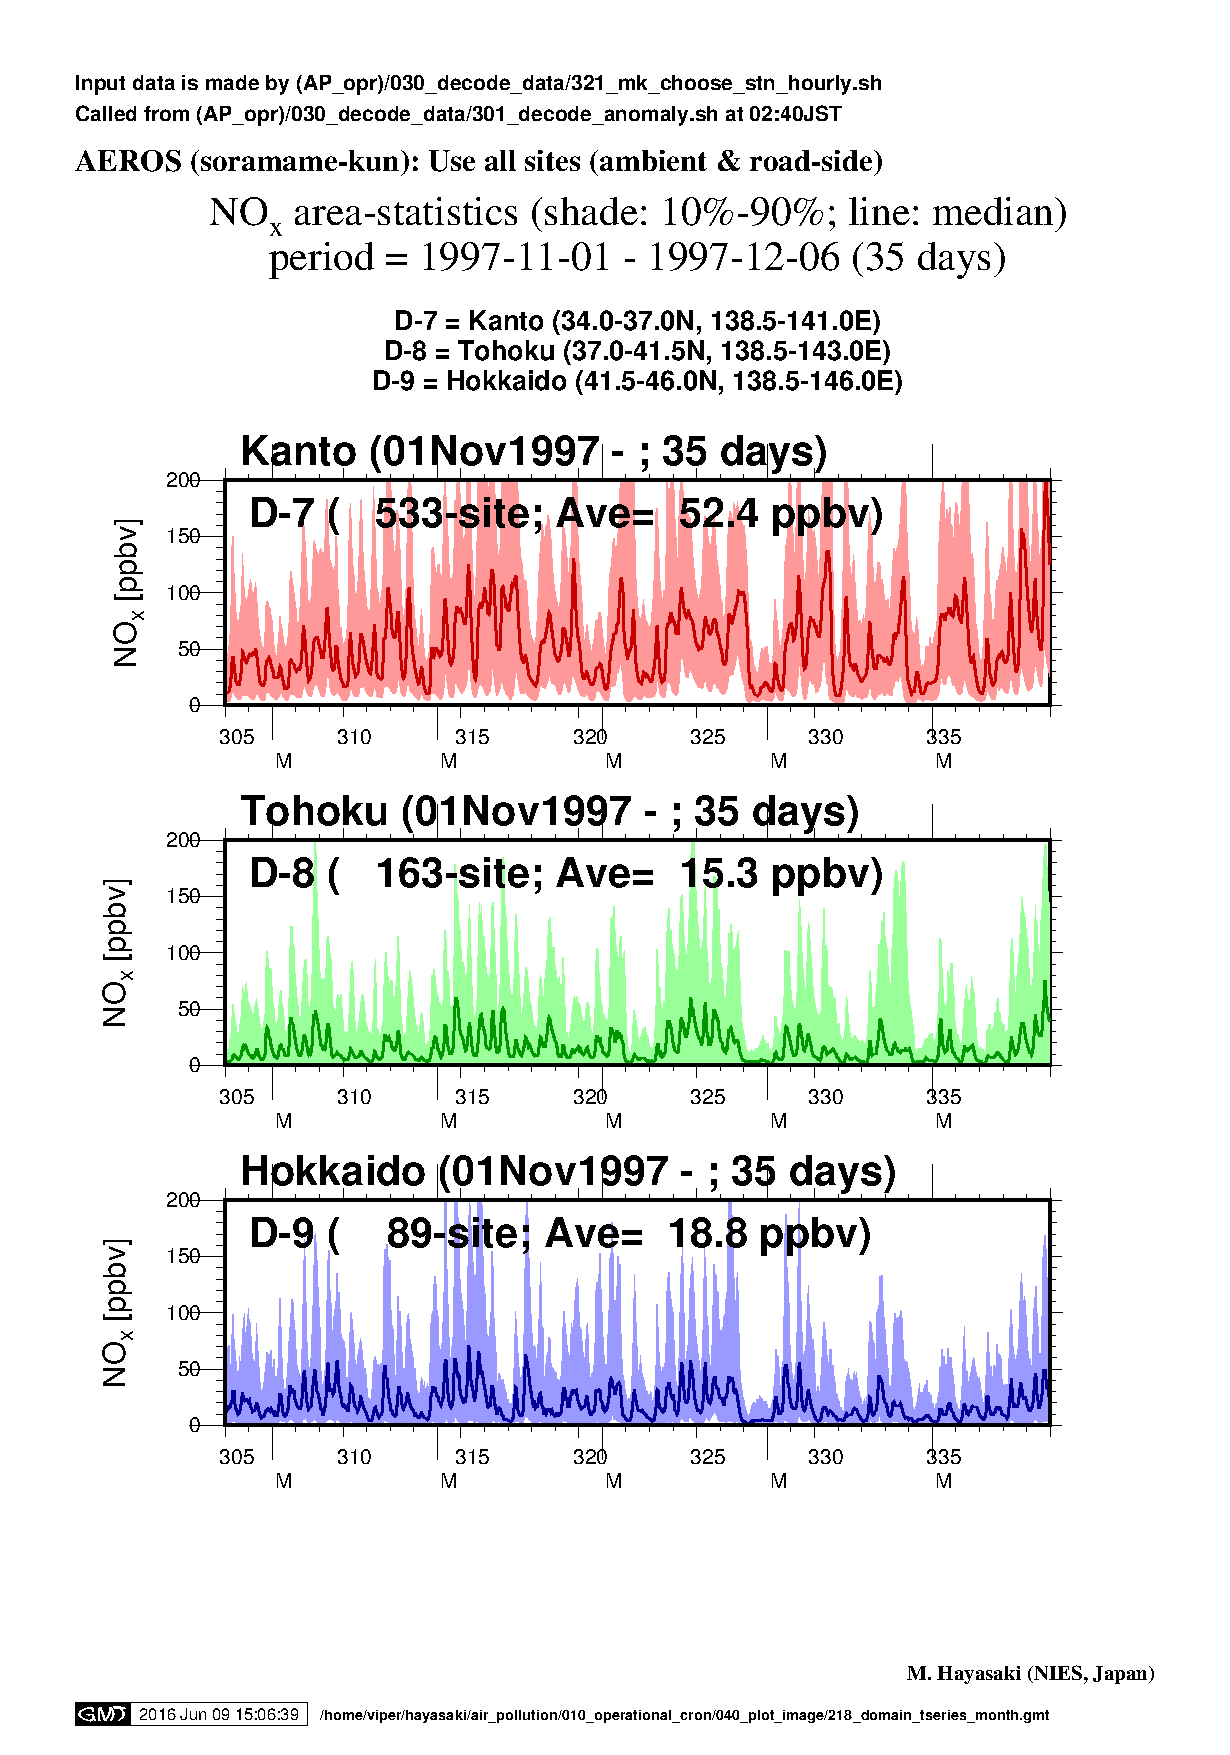
|
| Dec1997 (D7 - 9) |
|

|
NA |
|
| Month | Ox | SPM | PM2.5 | NOx |
参照資料
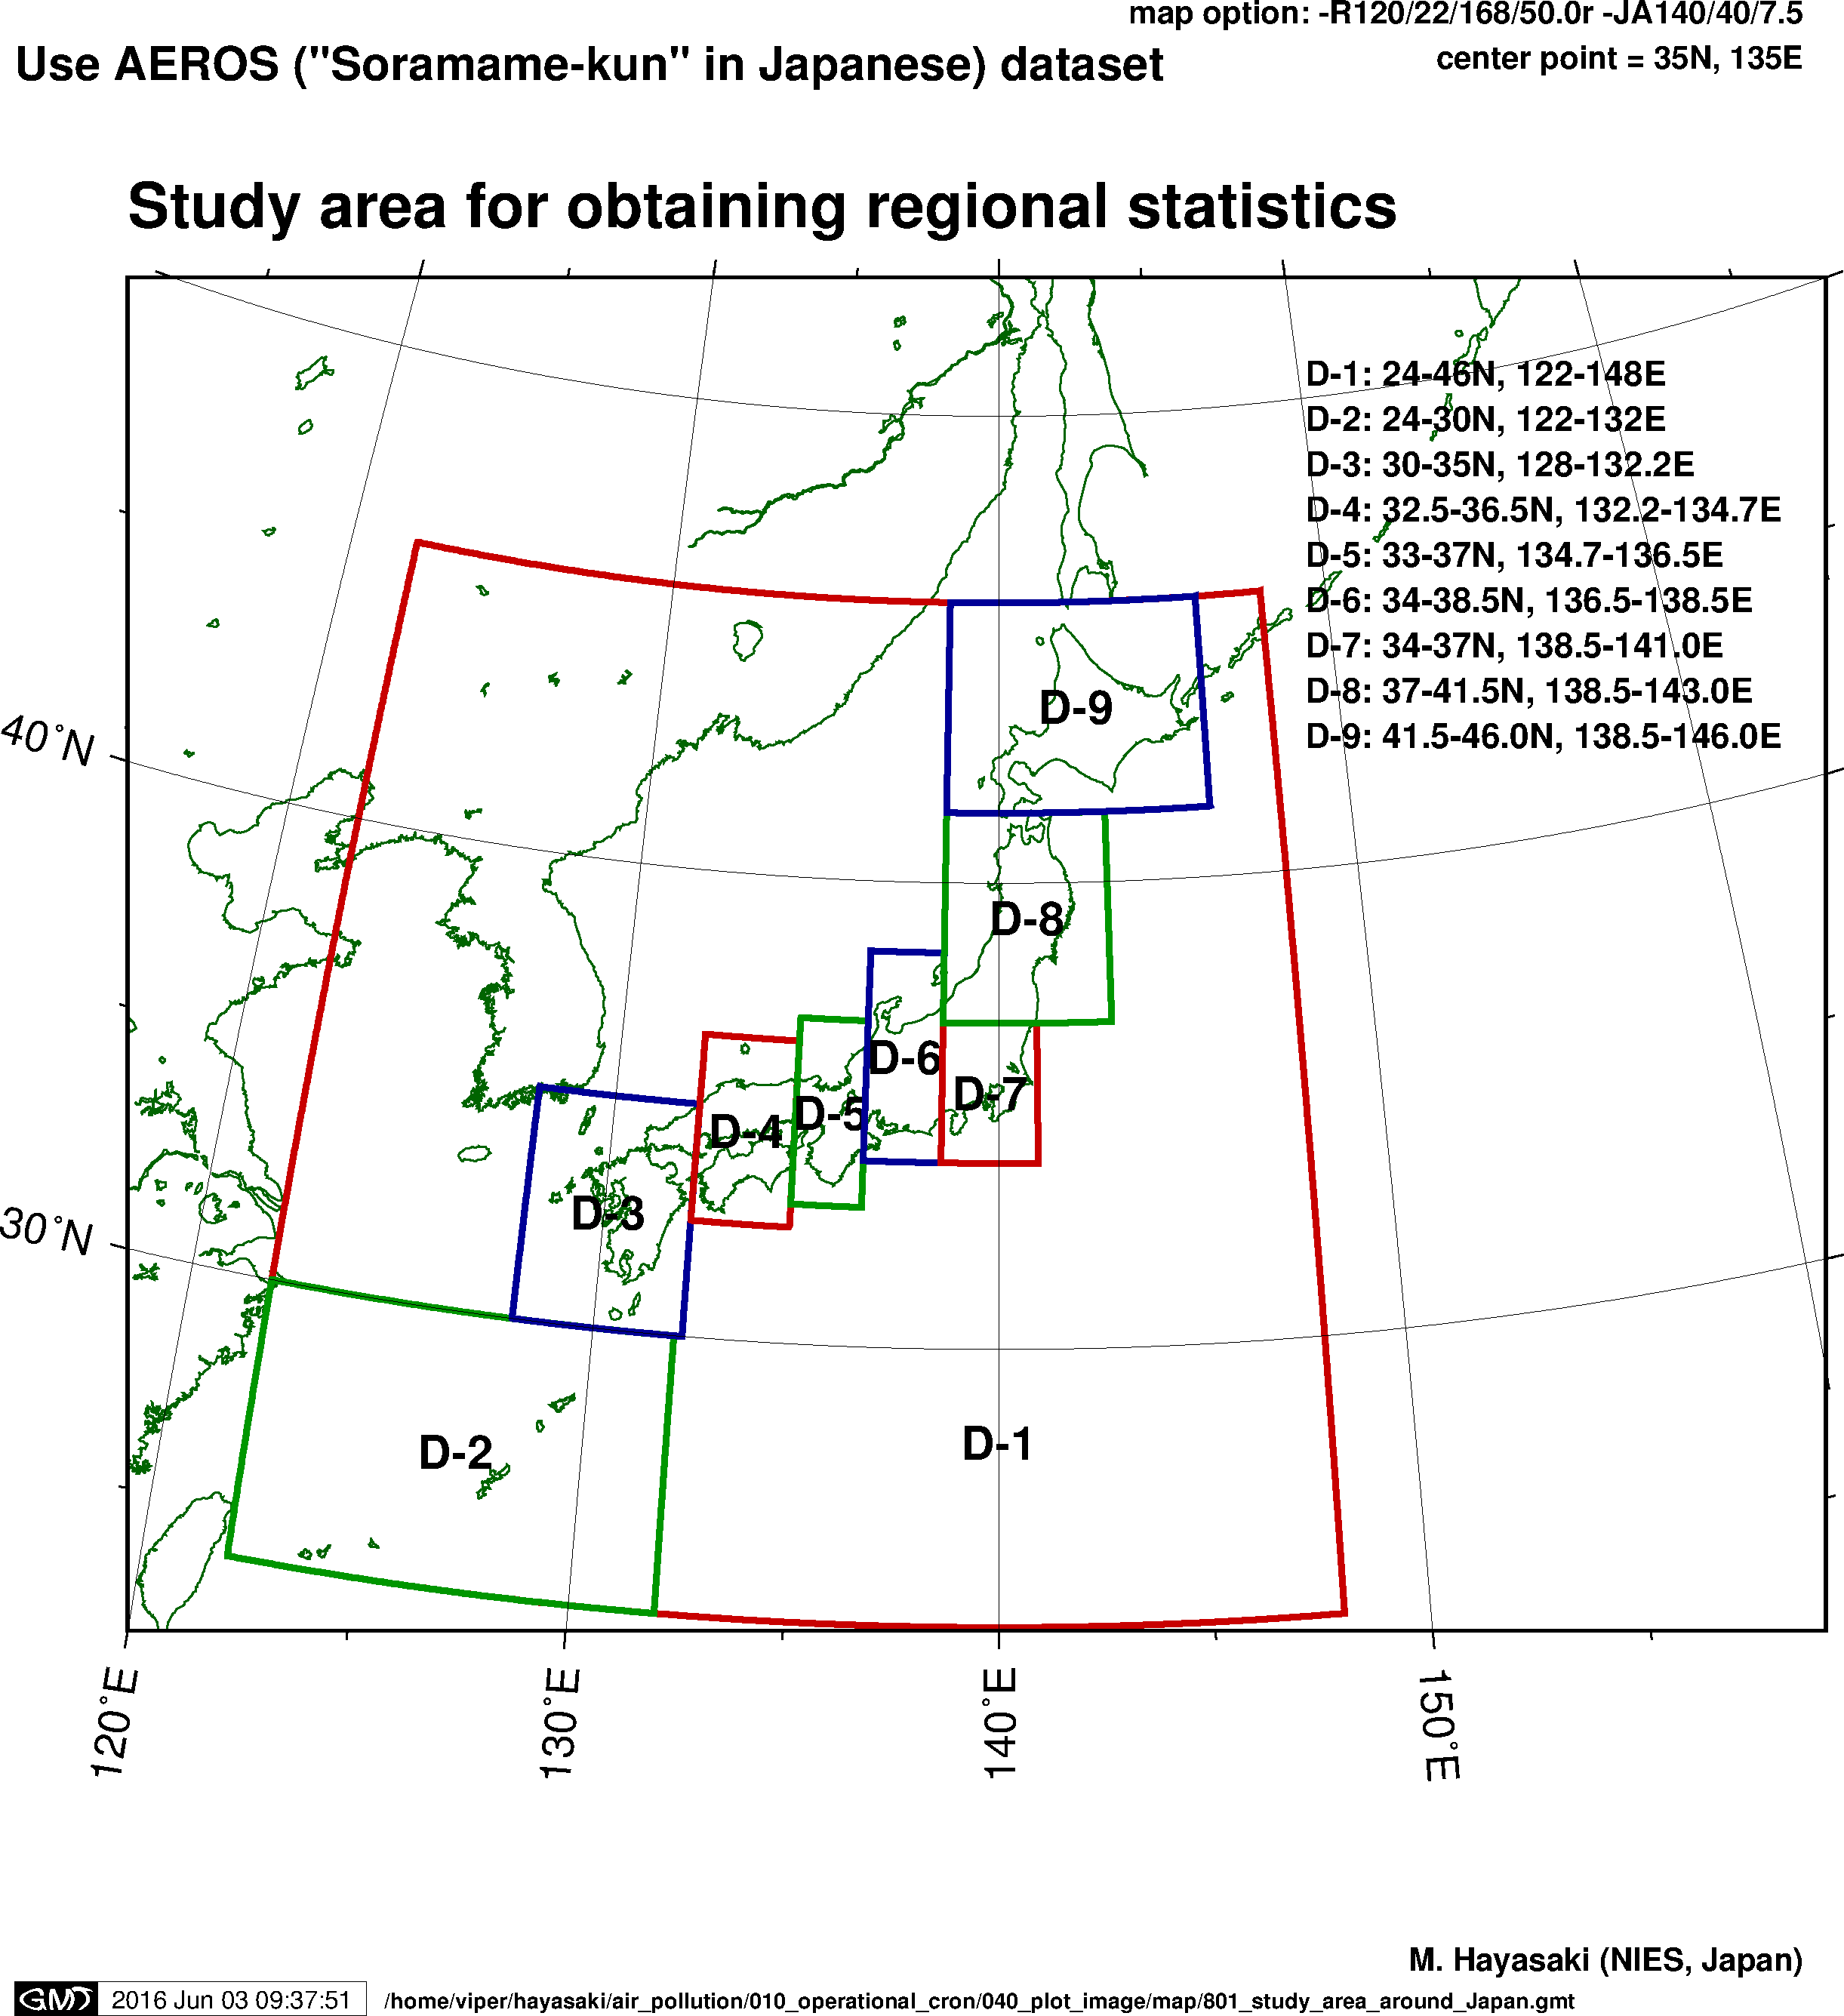
領域設定・統計値計算手順
| 領域設定 |
|---|
|
領域は全て矩形領域で設定.境界となる緯度経度は下記:
- Domain-1: 日本全国 (24.0-46.0N, 120.0-150.0E)
- Domain-2: 沖縄・奄美 (24.0-30.0N, 122.0-132.0E)
- Domain-3: 九州・山口 (30.0-35.0N, 125.0-132.2E)
- Domain-4: 中国・四国 (32.0-38.0N, 132.2-135.0E)
- Domain-5: 近畿 (33.0-37.0N, 134.7-136.5E)
- Domain-6: 中部 (34.0-38.5N, 136.5-138.5E)
- Domain-7: 関東 (34.0-37.0N, 138.5-141.0E)
- Domain-8: 東北 (37.0-41.5N, 138.5-143.0E)
- Domain-9: 北海道 (41.5-46.0N, 138.5-146.0E)
パーセンタイル値の算出手順は下記:
- 領域内の全測定局(一般局,自排局など)を使用
- 同一時刻のすべての有効測定データのパーセンタイル値(10, 50, 90%値)を算出. より正確に表現すると,パーセンタイル値に相当する濃度順位(小数点以下四捨五入)を算出し, その順位の測定局の値を使用.つまり,すべて整数値である.